Australian home values continue to rise, but pace of growth eases: Core Logic research
Australia’s rapidly rising property prices have started to slow, with new figures showing price growth eased last month after hitting a 32-year high in March.
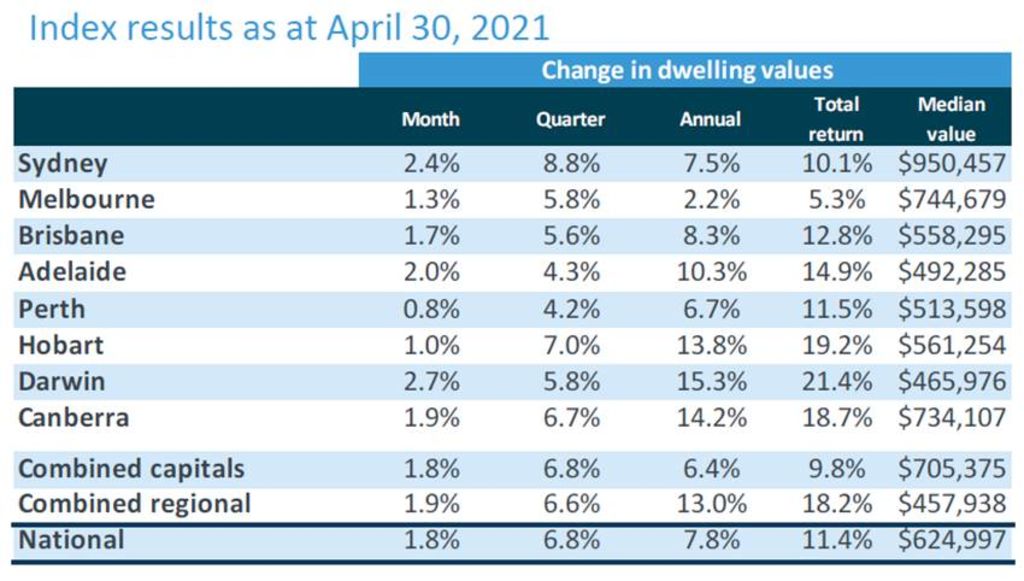
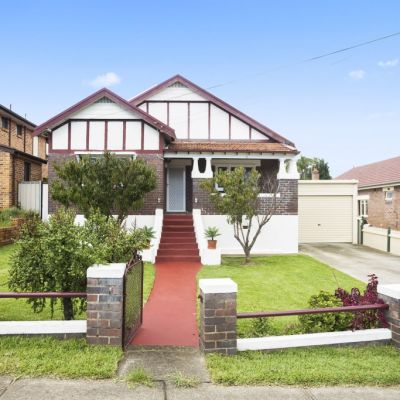
Property prices in Sydney jumped 2.4 per cent in April to a median value of $950,457, according to the CoreLogic Home Value Index released on Monday. The median value is now up 8.8 per cent over the quarter, with prices jumping by 3.7 per cent back in March.
Values in Melbourne increased by 1.3 per cent over the month to a median of $744,679 – down from a 2.4 per cent jump in March – and are up 5.8 per cent over the quarter. The figure includes both houses and apartments.
The slowdown in price rises was unsurprising given the rapid rate of growth seen in recent months, said Tim Lawless, CoreLogic’s research director.
He expected that the pace of capital gains, which is still quite rapid, could slow further in the coming months as the volume of homes on the market increased, and affordability constraints dampened housing demand – with the latest Australian Bureau of Statistics figures showing first-home buyer borrowing activity started to decline in February.
“With housing prices rising faster than incomes, it’s likely price-sensitive sectors of the market, such as first-home buyers and lower-income households, are finding it harder to save for a deposit and transactional costs,” he said.
“If we are starting to see [buyer] demand impacted by affordability constraints, at a time when supply levels are rising, it makes sense that we could start seeing a rebalancing between buyers and sellers.”
Despite the slowdown, every capital city and regional market continued to see prices rise over April.
Nationally, values rose 1.8 per cent over the month to a median of $624,997. It comes after values jumped 2.8 per cent in March, which was the steepest monthly price gain seen since 1988. Values are now up 6.8 per cent over the past three months.
Darwin saw the largest monthly increase of the capital cities, with values climbing 2.7 per cent to $465,976, resulting in annual growth of 15.3 per cent.
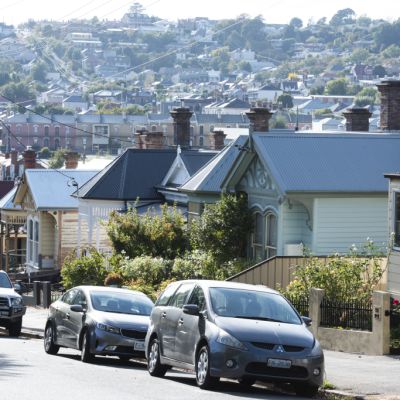
All four of the smallest capital cities recorded double-digit annual growth, with values in Adelaide, Hobart and Canberra, up 10.3 per cent, 13.8 per cent and 14.2 per cent, respectively. This reflected a smaller COVID-related disruption and an earlier start to the growth phase last year.
Melbourne recorded the lowest level of annual growth, at 2.2 per cent, due to the larger downturn seen off the back of its extended lockdown period last year. Meanwhile, Perth, which had a three-day lockdown last month, recorded the smallest monthly jump at 0.8 per cent.
Record-low interest rates, an improving economy and high consumer sentiment were supporting the housing market, Mr Lawless said, with values expected to continue rising – albeit at a slower rate – well into next year.
“It will be a gradual phenomenon until we see a greater catalyst like a credit intervention, and it doesn’t look like that is around the corner,” he said.
At the same time, new listing numbers have been on the rise, with more than 40,600 homes hitting the market last month, a substantial increase on the past two years and 14 per cent above the five-year average. However, strong demand is keeping the overall number of homes on the market low for now, with stock levels 25 per cent below the five-year average in late April.
Buyer demand has also seen the median selling time drop to a record low of 26 days and the median discount rate fall to a record low of 2.7 per cent across the capital cities.
“At the moment we’re seeing homes selling in record time … as we start to see new listings coming back into the market place those indicators might start to ease as well,” Mr Lawless said.
New listing numbers signalled an improvement in vendor confidence, with prospective vendors likely becoming more motivated to test the market, he added.
Across the country, houses continued to outperform units, with house values across the capital cities jumping 8.6 per cent since the start of the year, while units have climbed 4.3 per cent.
“A preference shift away from higher-density housing during a global pandemic is understandable; however, a rise in flexible working arrangements also seems to be supporting greater demand for houses around the outer-fringes of capital cities. Relatively weak investor activity, compounded by a supply overhang in some high-rise precincts, is also dampening price growth in unit markets,” Mr Lawless said.
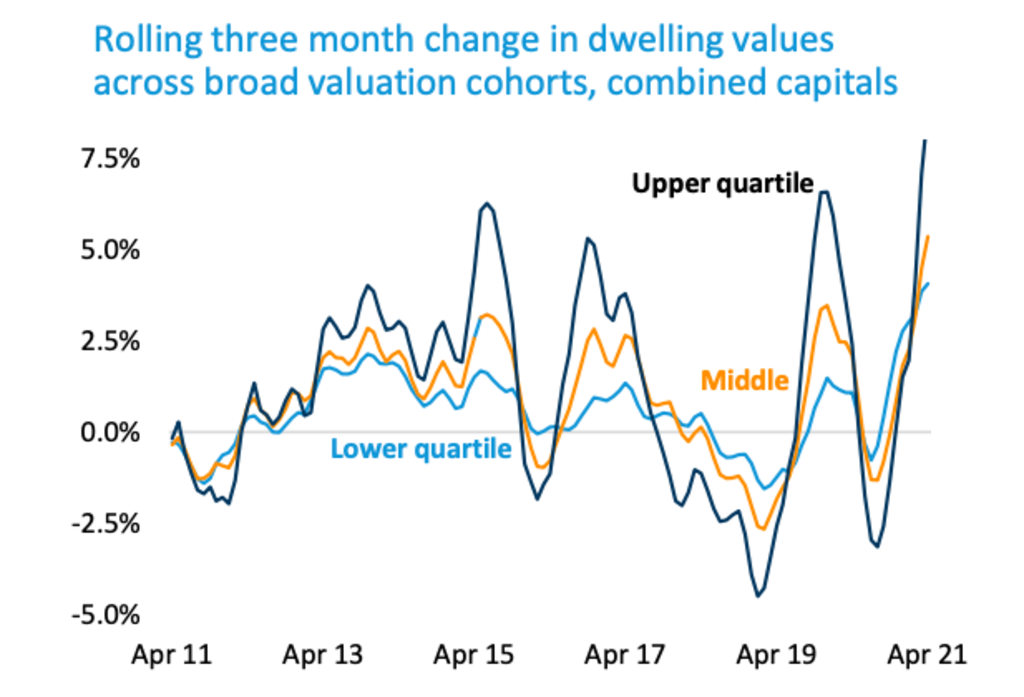
The top end of the market, which was harder hit in previous downturns, also continues to lead price growth, with upper quartile values jumping 8.8 per cent across the capital cities over the past three months, while the lower quartile lifted 4.1 per cent.
This pattern was most evident in Melbourne, Brisbane, Adelaide and Sydney, with the latter recording the largest gap: upper quartile values rose by 11.4 per cent over the past three months, while the lower quartile increased 5 per cent.
We recommend


We thought you might like


States
Capital Cities
Capital Cities - Rentals
Popular Areas
Allhomes
More
