Australians are making a median of $326,000 from selling their houses, new data finds
As Australia’s property market reaches new heights, more home owners than ever are reaping substantial profits from selling their properties.
The new Domain Profit & Loss Report reveals that the proportion of profit-making resales has reached multi-year highs in many cities. Brisbane leads the charge with 99.5 per cent of houses selling for a profit.
Nationally, the median profit is $326,000 for houses and $171,000 for units – a 16-year and 13-year high, respectively.
In the regions, the median profit is $245,000 for houses– the highest since 2009 – and $196,000 for units. The latter is much higher than in the combined capital cities, where the figure is $163,000.
“More home owners in over a decade are walking away with a profit,” despite high property prices, says Domain chief of research and economics Dr Nicola Powell.
“It tends to closely follow the property price cycle, with the likelihood of profitability increasing as prices rise.”
Surprisingly, the ones reaping the most profit are not Baby Boomers but Generation X and older Millennials, typically in their late 30s and 40s.
“While Boomers have certainly reaped significant rewards from decades of rising home prices, it is their children who are walking away with the most profit in today’s market,” Powell says.
“Those in their late 30s to late 40s are well established in their careers, have equity from their current home, and have the financial capacity to upsize” in terms of borrowing capacity.
| City | Suburb | Age | Weekly income | Profit |
| Sydney | Galston | 46 | $2,295 | $1,025,000 (228%) |
| Sydney | Wakeley | 41 | $1,553 | $775,000 (221%) |
| Sydney | Neutral Bay | 38 | $2,443 | $1,095,000 (187%) |
| Melbourne | Somers | 53 | $1,906 | $883,500 (268%) |
| Melbourne | Cannons Creek | 41 | $1,607 | $552,500 (249%) |
| Melbourne | Wonga Park | 45 | $2,790 | $848,500 (212%) |
| Brisbane | Pullenvale | 43 | $4,149 | $1,237,500 (189%) |
| Brisbane | Wishart | 39 | $2,026 | $761,444 (187%) |
| Brisbane | Sadliers Crossing | 40 | $1,491 | $418,000 (159%) |
| Adelaide | Colonel Light Gardens | 42 | $2,491 | $1,190,750 (223%) |
| Adelaide | Westbourne Park | 44 | $2,164 | $1,035,000 (193%) |
| Adelaide | Kensington Gardens | 45 | $1,571 | $865,000 (191%) |
| Perth | Rossmoyne | 48 | $2,146 | $1,010,000 (289%) |
| Perth | City Beach | 47 | $3,700 | $865,605 (162%) |
| Perth | Willetton | 40 | $2,178 | $608,000 (131%) |
| Canberra | Hawker | 42 | $2,251 | $749,000 (165%) |
| Canberra | Garran | 41 | $2,985 | $898,750 (154%) |
| Canberra | Lyneham | 35 | $2,084 | $731,000 (146%) |
Brisbane-based buyer’s agent Lauren Jones has seen Generation X and older Millennial owners make more when selling their properties. This has typically led to them being able to own bigger or nicer properties in the next step of their journey.
“People are cashing in, especially people of this age [range] where they’ve made a lot of money in a short period of time,” she says. “These people are used to [high] interest rates, so that’s not deterring them from selling, and they’re taking out large or much larger mortgages.
“One thing I noticed is that [Generation X and older Millennials] tend to be more open to spending money on marketing the home, including things like staging properties. And I find that many of the Baby Boomers might have slightly more dated or original-condition homes that aren’t fetching high profits, or the high prices that the nicely styled homes do.”
While Brisbane is the best performer, with 99.5 per cent of houses selling for profit, Melbourne comes in second highest at 97.9 per cent.
Powell says it might seem unusual for Melbourne to record strong profits since it has yet to see a house price recovery, but the figure is much lower than in 2022, when 99.3 per cent of houses sold for profit.
|
Location
|
Houses | Units | ||
| Profit | Loss | Profit | Loss | |
| Australia | 96.00% | 4.00% | 90.70% | 9.30% |
| Combined capitals | 96.00% | 4.00% | 89.40% | 10.60% |
| Combined regionals | 96.10% | 3.90% | 94.60% | 5.40% |
| Sydney | 95.60% | 4.40% | 89.40% | 10.60% |
| Melbourne | 97.90% | 2.10% | 85.30% | 14.70% |
| Brisbane | 99.50% | 0.50% | 95.60% | 4.40% |
| Adelaide | 96.80% | 3.20% | 89.90% | 10.10% |
| Perth | 97.10% | 2.90% | 91.10% | 8.90% |
| Canberra | 94.00% | 6.00% | 94.40% | 5.60% |
| Hobart | 96.80% | 3.20% | 96.30% | 3.70% |
| Darwin | 88.40% | 11.60% | 68.20% | 31.80% |
Despite Sydney’s record median house price of $1.6 million, it’s the city with the third-lowest proportion of profit-making house sales at 95.6 per cent. However, when converting the profit into dollar values, Sydney still leads, with houses making a median profit of $655,000
Canberra then follows at $435,000, then Melbourne at $397,000, Brisbane at $395,000 and Adelaide at $351,000.
For units, Hobart leads the way with the highest proportion of profit-making sales at 96.3 per cent. Darwin sits at the bottom of the pack with only 68.2 per cent.
In terms of unit dollar gains, Sydney, Hobart and Adelaide take the lead, with profits of $202,000, $198,000 and $175,000, respectively.
Powell says locations like Hobart and Adelaide have higher unit dollar gains due to the smaller pool of stock available. This shortage of affordable apartments in the heart of a city’s CBD drives higher prices and – consequently – higher dollar gains.
In some suburbs, units outperform houses in terms of profit margins. Many of the suburbs with more significant unit profit margins are destinations for holidaymakers, where people will prefer to buy units due to greater affordability, Powell says.
| Suburb | Capital | Unit profit | Houses profit | Unit profit premium |
| Evanston | Adelaide | 142.9% ($200,000) | 46.0% ($145,000) | 96.90% |
| Rosanna | Melbourne | 147.1% ($500,000) | 60.5% ($447,500) | 86.60% |
| Semaphore Park | Adelaide | 156.0% ($312,000) | 85.2% ($371,000) | 70.80% |
| Pinjarra | Perth | 128.5% ($210,750) | 70.9% ($198,500) | 57.60% |
| MacLeod | Melbourne | 108.1% ($465,000) | 58.8% ($414,750) | 49.30% |
| Long Jetty | Sydney | 130.2% ($385,500) | 84.5% ($403,000) | 45.70% |
| Heathmont | Melbourne | 105.5% ($371,500) | 61.7% ($385,000) | 43.80% |
| Modbury | Adelaide | 125.0% ($235,000) | 82.9% ($304,000) | 42.10% |
| Aspendale | Melbourne | 123.9% ($452,350) | 86.5% ($562,000) | 37.40% |
| Kilsyth | Melbourne | 93.4% ($344,000) | 58.3% ($272,750) | 35.10% |
In the Sydney suburb of Long Jetty, for instance, unit profits outperformed houses by 45.7 per cent.
Long Jetty real estate agent Graeme Naughton of LJ Hooker The Entrance says this is due to the constantly high demand for more-affordable units.
“People who can’t buy a house in Long Jetty come back and buy a unit, which is generally half the price [of a house],” he says.
Overall, the entire market is turning a profit, Powell says, and even the small number of suburbs that have experienced a loss are in areas where most resales turned a profit.
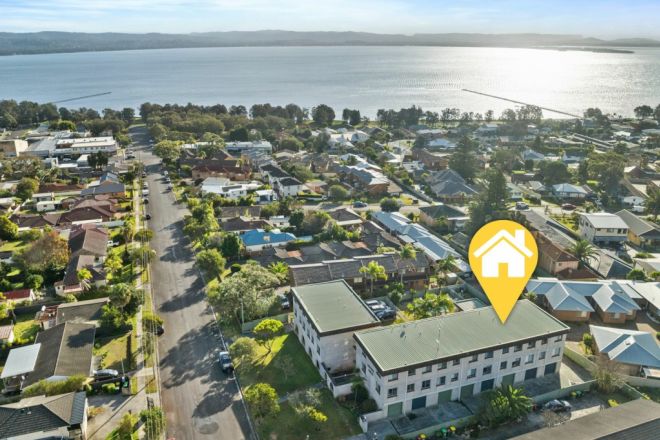
“Across Australia, only 33 suburbs incurred a portion of sales at a loss for houses – a mere 1 per cent of the suburbs analysed,” she says. “For units, there were 206 suburbs that had a portion of loss-making sales – 14.8 per cent of the suburbs analysed.”
Powell says home owners worried about losing money should take a long-term perspective.
“Home owners are reaping the benefits from that longer-term play, in terms of being in the property market for a longer period of time, riding the waves of multiple property cycles,” she says.
“If you’ve purchased well and you are selling under today’s conditions, the chance of a loss-making resale is very slim.”
We recommend
We thought you might like
States
Capital Cities
Capital Cities - Rentals
Popular Areas
Allhomes
More
- © 2025, CoStar Group Inc.


