Australia's housing market boom ranked seventh in the world: Knight Frank report
Australia’s housing boom is one of the fastest growing in the world, a new report has revealed, as the country recorded its highest rate of annual price growth in decades.
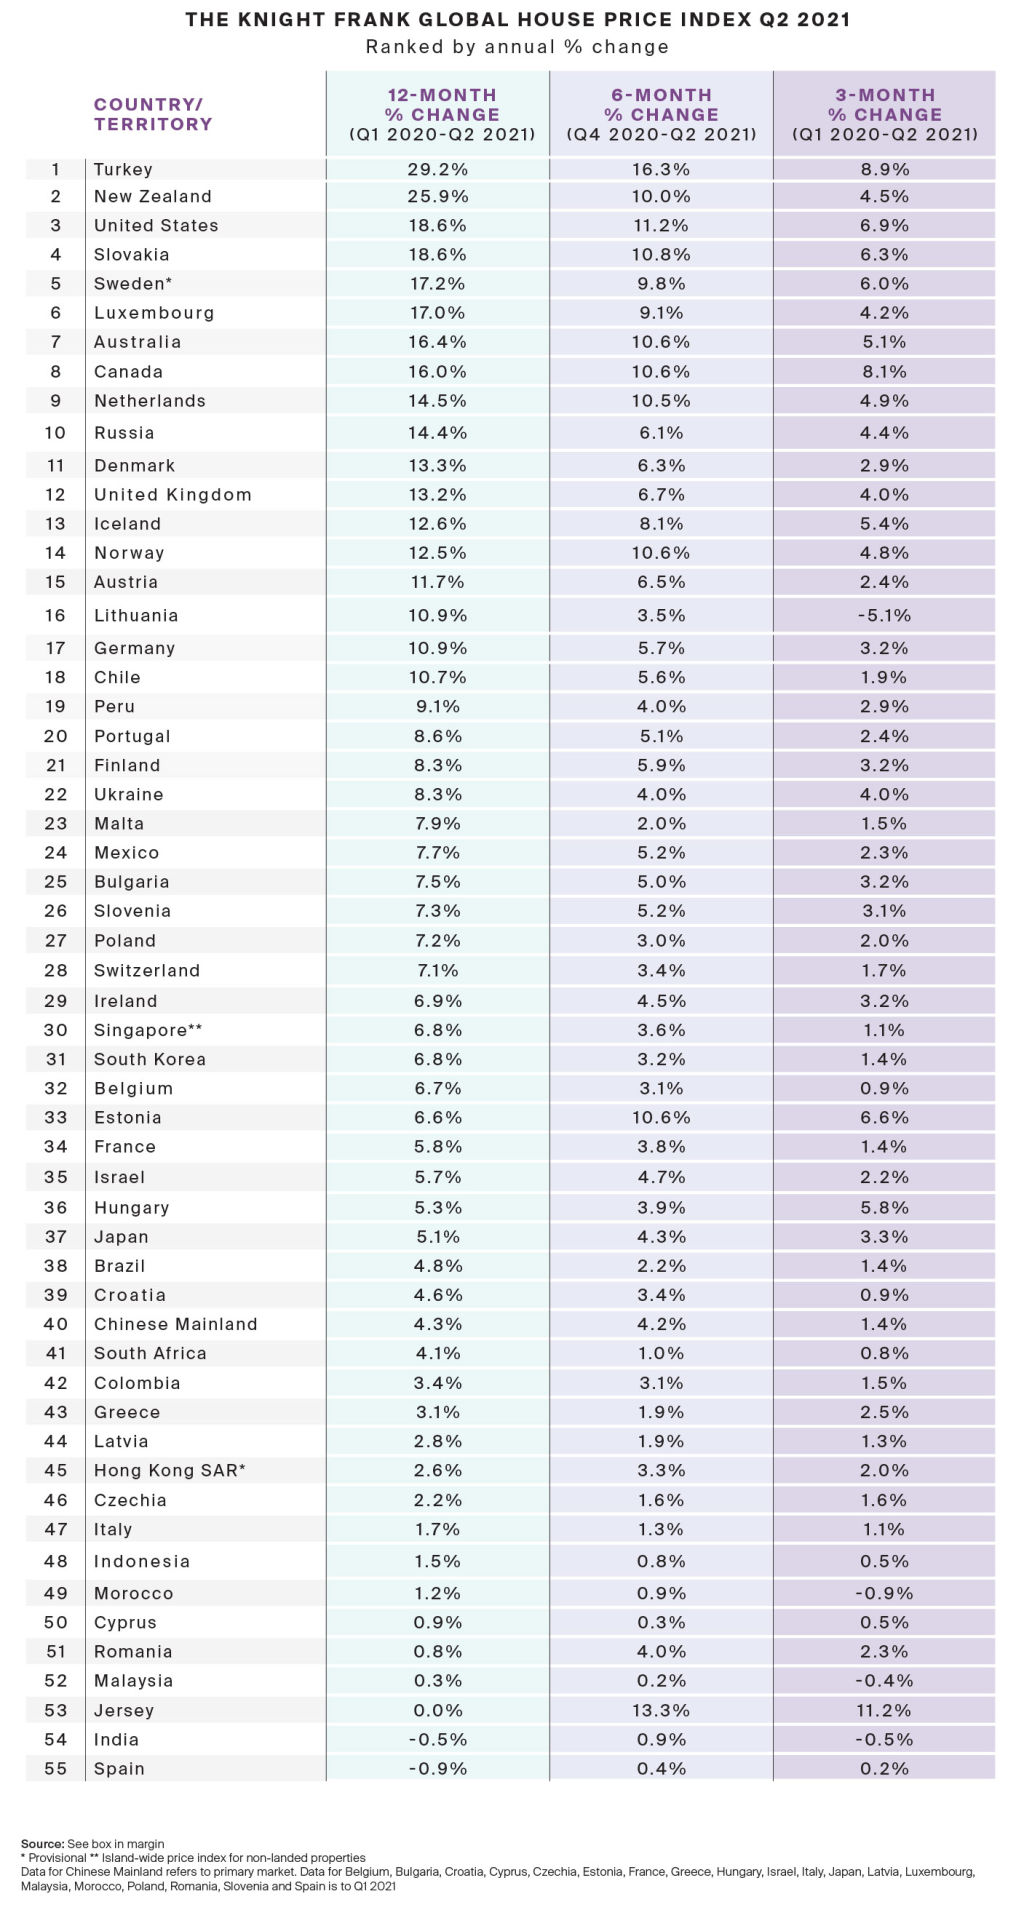
Australia ranked seventh out of 55 countries for annual price growth, at 16.4 per cent for the year ending June, the fastest annual pace since 2003, Knight Frank’s Global House Price Index for the second quarter of 2021 found.
It is up from the previous quarter, when it ranked 18th with 8.3 per cent annual growth, and up from the past year, when it ranked 19th with 6.1 per cent annual growth.
While some markets have shown signs of softening demand, the index said recent tighter COVID restrictions in Australia “may yet spark renewed activity as lockdowns shine a light on homes and lifestyles”.
It comes as the index is now rising at its fastest rate since the first quarter of 2005, with more than a third of housing markets (18 countries) registering price increases of 10 per cent or more in the year ending June.
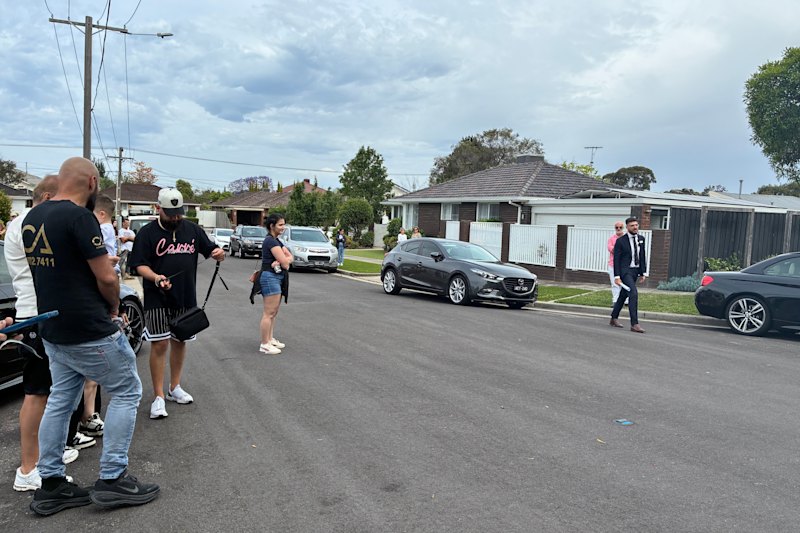
Knight Frank head of residential research Michelle Ciesielski said there were more buyers than there were homes, driving up the housing market in Australia.
“Scarcity remains the key driver for the significant growth in residential values across Australia, with pent-up demand from those engaging in an incredibly low interest-rate environment,” Ms Ciesielski said.
While Australia’s property boom has been inconsistent city-to-city in the past, this latest upswing was widespread, she said. “We are seeing consistent double-digit annual growth in each capital city, although underlying factors do differ as you dive into each market.”


Every capital city in Australia recorded an increase in annual sales volume, with a 30 per cent average, Ms Ciesielski said.
The number of days a property was listed on the market fell by 24 per cent in the year to June 2021 – the equivalent of almost a month saved off the average Australian property listing, she said.
“If our economy was in a more stable position with this performance, we may have seen the delayed APRA revised lending standards brought forward, but for now, Australian homeowners are watching their property values rise at the fastest rate since 2003,” Ms Ciesielski said.
“Australia’s lending environment has also become considerably more responsible since this time.
“The last time tighter lending restrictions were enforced to cool the market, Australia slipped down into last place on the Global House Price Index in early 2019 for three consecutive quarters, with annual growth falling by an average of 6.6 per cent.
“Back then, it was Sydney and Melbourne which influenced the overall growth in Australian property prices, ultimately leading to the more responsible lending regime. Now we are experiencing more activity in the smaller capital cities, driving up this Australian residential growth.”
Across the 55 countries, the pandemic-induced housing boom continued, with prices rising by 9.2 per cent on average in the year to June 2021, the Index found.
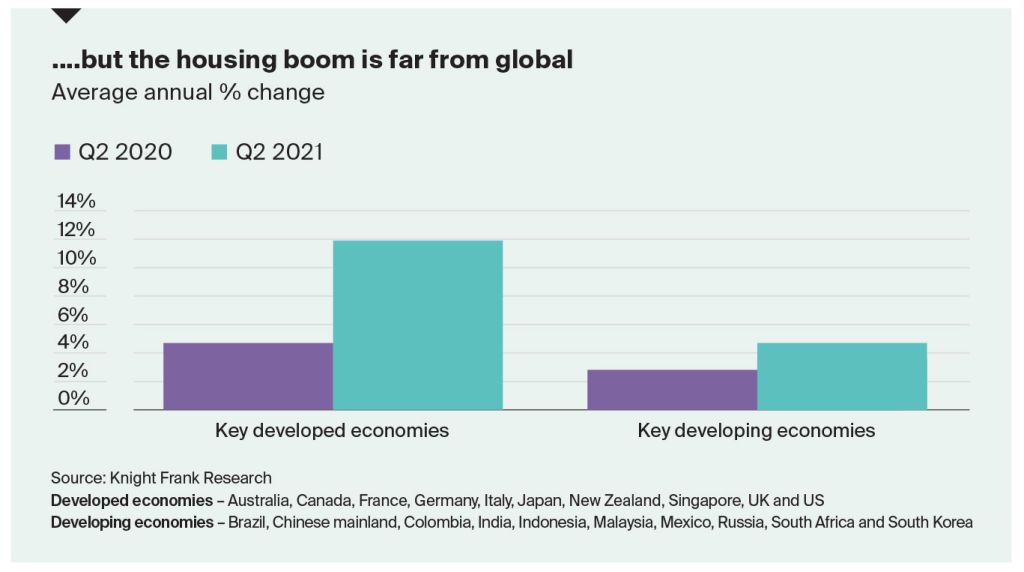
But it highlighted that it was a two-speed market between developed and developing countries.
Ten of the world’s developed economies posted average annual house price growth of 12 per cent in the year to June 2021, double the pace of key developing economies at 4.7 per cent, the index said.
Turkey topped the list with its housing prices up 29.2 per cent and its rate of growth slowing, the Index found.
Other developed countries that made it into the top 10 with Australia were New Zealand up 25.9 per cent, the United States up 18.6 per cent, Canada up 16 per cent and Russia up 14.4 per cent.
The only two housing markets that recorded price declines were India and Spain, which was the lowest proportion of markets registering a decline in prices since the index began in 2008.
We recommend


We thought you might like


States
Capital Cities
Capital Cities - Rentals
Popular Areas
Allhomes
More
- © 2025, CoStar Group Inc.
