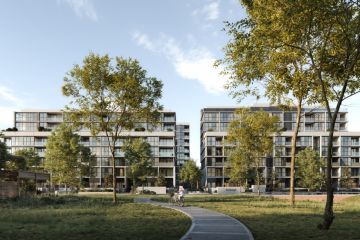
Canberra unit prices plummet to four-year low: Domain report
Canberra’s median unit price has dropped to a four-year low, according to the latest Domain March Quarter 2018 House Price Report.
The report shows Canberra’s median unit price decreased 2.2 per cent over the March quarter to $411,004. This represents an annual decline of 3.5 per cent and is the lowest unit prices have been in the nation’s capital since March 2014.
Domain chief data scientist Dr Nicola Powell said Canberra’s unit market has been stagnating for close to ten years.
“We haven’t seen any significant growth in the unit market for a few years,” she said.
“It’s fluctuated but overall there hasn’t been any period of sustained growth since 2009-10.”
Dr Powell attributed Canberra’s negative growth in the unit market to oversupply.
“Urban densification taking place across the city has increased unit supply and continues to negatively impact Canberra’s unit values,” she said.
“However, population growth, particularly interstate migration, has helped to absorb the heightened unit supply.”
Real Estate Institute of the ACT president Michael Kumm said investor disappointment in the local market was pushing the unit price down.
“A lot of landlords are disenchanted with increases in rates and land tax, and therefore a reduced return, so they’re selling their investment properties,” he said.
“A substantial number of them have been picked up by owner-occupiers and this is causing an issue in the rental market leading to decreased vacancy rates.”
This comes after the ACT government introduced a bill earlier this month that would increase Treasury’s land tax revenue by an estimated 45 per cent over the next five years.
- Related: Renting in Canberra is nearly as pricey as Sydney
- Related: Canberra’s median house price surges to record high: Domain report
- Related: Canberra’s median house price continues to rise: Domain report
Whilst the unit market experienced a decline, the Canberra housing market continued to rise, experiencing a quarterly increase of 0.8 per cent to $727,914*. This is the sixth consecutive quarter for house price growth in Canberra and the second-highest quarterly growth in the nation, behind Hobart at 2.7 per cent, and on par with Adelaide.
Annually, there has been a growth of 3.3 per cent in Canberra’s median house price.
Both Canberra’s house and unit prices are the third-highest in the country, behind Sydney and Melbourne. A house in Sydney will set you back $1.15 million, while a unit will cost $740,041. In Melbourne, a house will cost you $914,518, while a unit will cost $505,861.
“The housing market is the standout performer in the territory and I think overall we will continue to see growth in the Canberra housing market, although the annual pace of growth is starting to slow,” said Dr Powell.
Dr Powell said Canberra’s population growth was contributing to rising house prices, with latest ABS figures showing the ACT only behind Victoria in population growth rate, recording an increase of 1.8 per cent from the 12 months ending September 30, 2017.
“The growth in the price in the housing market is not a surprise, the population is increasing substantially with around 6000 people arriving in the ACT with employment,” added Mr Kumm.
“Also, due to the government push for medium to high density there’s a shortage of single residential dwellings on blocks.”
While Canberra’s falling unit prices are seemingly ideal for first home buyers, some are finding luck in off-the-plan townhouse developments.
Tayla Shields has recently purchased her first home in Denman Prospect at the Polo development.
The 23-year-old said she was motivated to buy a home after comparing loan repayments and weekly asking rents.
Ms Shields said she was set on a townhouse and was reluctant to buy into the unit market**.
“I was definitely trying to weave away from apartments because, based on research, I discovered an oversupply that was a reason why unit prices are falling,” she said.
“Everyone hopes in the long run that their property will go up in value.”
To prevent a further decline in unit prices, Dr Powell said Canberra needs to continue to provide an array of housing options.
“What is important for Canberra is to retain a diversity of housing, particularly townhouses, we are known as the Bush Capital after all,” she said.
*Figures from the Domain December Quarter 2017 House Price Report have been adjusted. The most accurate data is presented above.
** Townhouses are grouped with houses in the report.
We recommend
States
Capital Cities
Capital Cities - Rentals
Popular Areas
Allhomes
More


