Canberra's auction performance improves over February
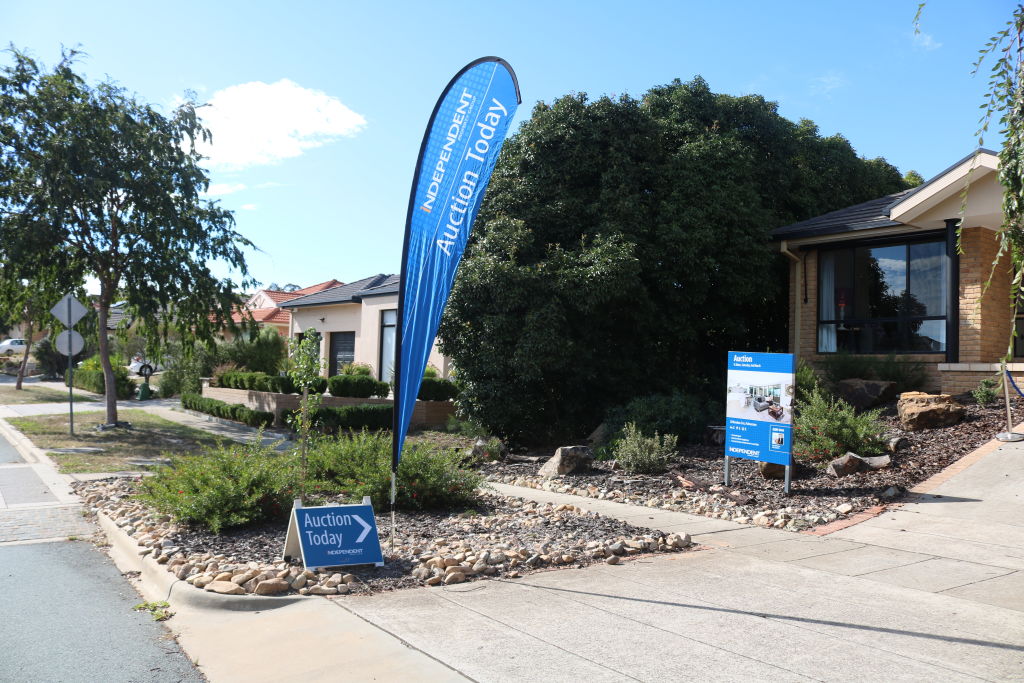
Canberra’s property clearance rate bounced back slightly last month after it dropped to five-year lows at the end of 2018.
From 258 reported auctions, 51 per cent of properties auctioned sold under the hammer in February. Another 20 properties sold prior to auction and 22 were withdrawn.
Houses outperformed units, with 53 per cent selling under the hammer compared with 40 per cent of units.
February’s clearance rate was a significant jump on prior months. In December only 43 per cent of auctioned properties were sold on the day, and in January the clearance rate was 39 per cent, however, only 48 properties were auctioned over the month which is well below the two-year average of 293.
“With just over half of all scheduled auctions selling under the hammer, this is a noticeable improvement from the November and December lows,” said Domain senior research analyst Dr. Nicola Powell.
“A bounce in clearance rates tends to occur early in the season as serious buyers become active following the summer break.”
- Related: Chapman home sells $330k above reserve
- Related: There’s a new norm emerging in Canberra’s auction market
- Related: Should you sell your home before you buy in Canberra?
While the clearance rate is an improvement on recent months, year-on-year it has declined 10 per cent.
The number of properties sent to auction has also declined. In February 2018, 329 properties went under the hammer, compared to 258 in February 2019.
February’s auction numbers were also down on November and December 2018, at 474 and 291, respectively.
Dr Powell said the lower volume has helped to boost the clearance rate.
On a regional level, Queanbeyan recorded the lowest clearance rate in February at 36 per cent, while Tuggeranong had the best performance at 62 per cent.
The Inner South was the only region to record a higher year-on-year clearance rate; 55 per cent of properties sold under the hammer, compared to 45 per cent in February 2018.
The total supply of properties on the market has increased in the nation’s capital over the year. In February, there were 1665 houses listed over the month, a year-on-year jump of 29 per cent. Units were not far behind with 1621 listed, a year-on-year jump of 26 per cent.
Gungahlin had the largest number with 439 houses and 244 units on the market over the month.
Weston Creek had the fewest properties for sale with 76 houses and 23 units.
In the three months to February 2018, the average days on market for houses in Canberra was 70, and for units, it was 84.
On the district level – measured in the six months to February 2018 – Weston Creek had the shortest average days on market for houses at 36, while Woden Valley had the longest at 85.
In the unit market, Gungahlin and Tuggeranong have the lowest average days on market at 68 while Queanbeyan had the longest at 140.
We recommend


We thought you might like

States
Capital Cities
Capital Cities - Rentals
Popular Areas
Allhomes
More
