ACT regions property guide: How has your suburb performed?
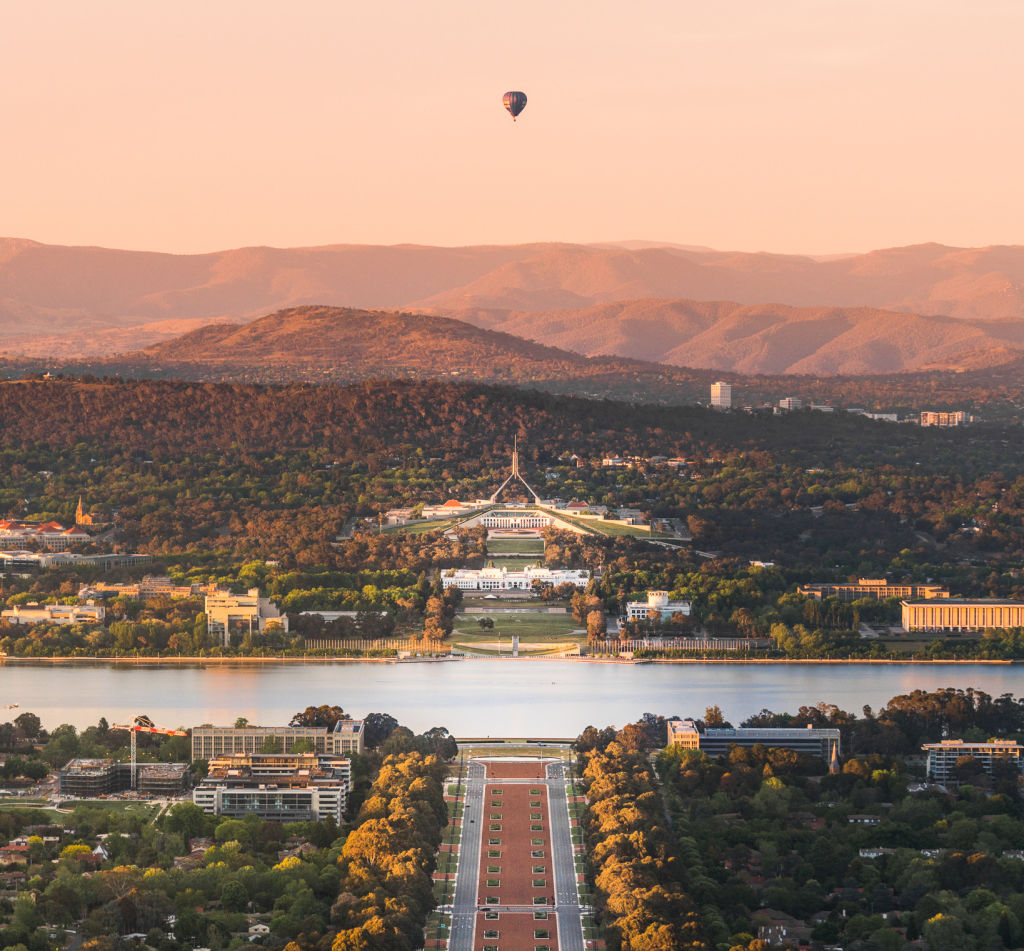
What a wild ride this last week has been – so much so it feels contrary to publish an overview of the capital’s booming property market amidst a lockdown.
But a boom is exactly what our little, overachieving city experienced in the six months to June this year – 52 suburb records broken, state-wide auction clearance rates above 80 per cent every month and our overall median house price cracking $1 million in the last quarter.
In the first half of 2021, Canberra’s property market was a shining success story. The capital hit a record-high median house price of $1,015,833 – the steepest price acceleration in almost three decades, seeing it join the million-dollar club with Sydney and Melbourne.
At a regional level, the stand-out was Woden Valley, which had the highest yearly growth for houses of all ACT regions, up 34.4 per cent to $1.21 million.
It’s no mean feat and, despite the recent pivoting to digital sales methods, the local real estate industry has truly weathered the storm and come out the other side as agile as ever and armed to take on whatever is thrown our way next.
Let this special regions guide be a tool to tackle your next home purchase and a guiding light into what makes the property markets in each Canberra region tick.
— Josephine Huynh, Allhomes editor
A perfect combination of factors has created extraordinary growth in our local housing market throughout 2021. Ultra-low home loan rates, government stimulus and higher household savings spurring buyers.
This has provided record-breaking outcomes, as house prices rise at the fastest pace on record.
— Dr Nicola Powell, Domain chief of research & economics
Gungahlin: Gunning for growth
Population: 84,684
Median house price: $820,000
YoY change: 14.5%
Median unit price: $466,000
YoY change: 6.2%
Clearance rate: 84%
Source: Australian Bureau of Statistics & Domain Group, January-June, 2021
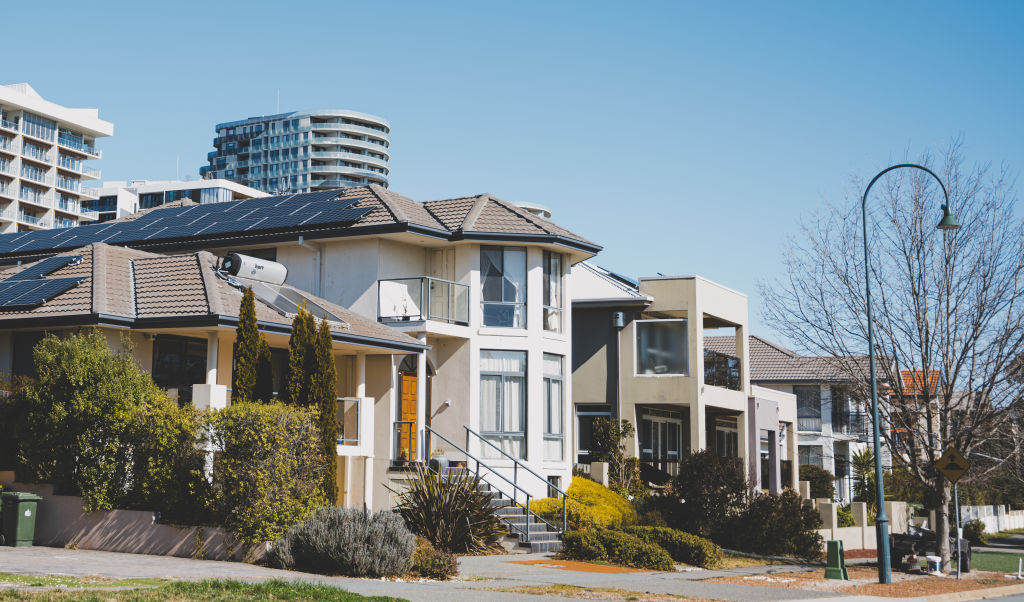
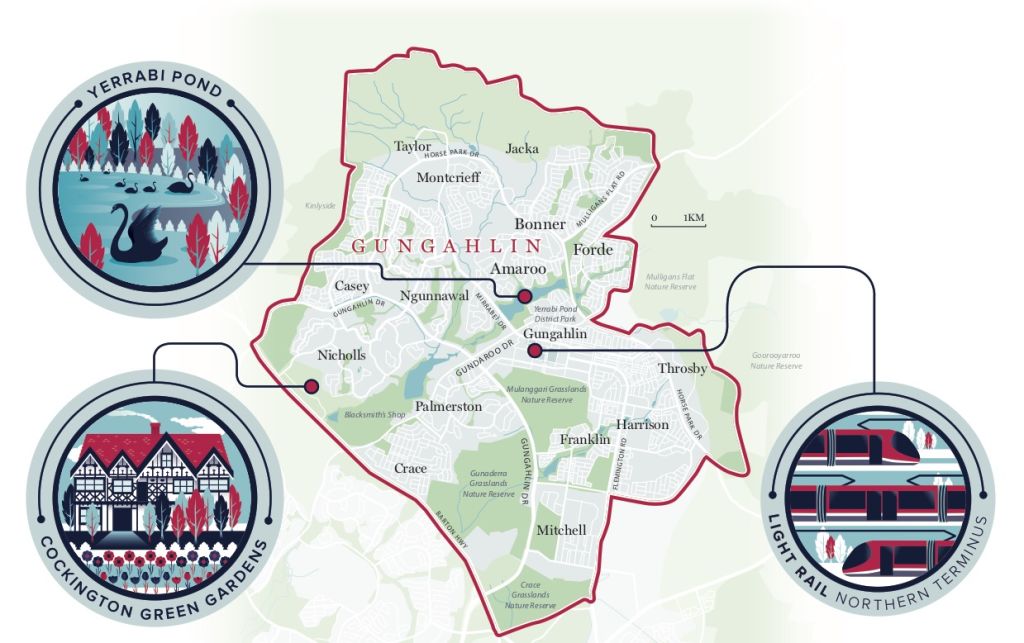
Gungahlin, or “Gunners” as the locals refer to it, is the north-side region that is always growing.
Bordered by Mulligans Flat Nature Reserve and Yerrabi Pond, Gungahlin also has the picturesque Ginninderra Creek running through it.
The region continues to lure home-buyers to its newer, modern properties and, with the light rail and a cinema set to grace the area, it’s on track to becoming a bustling metropolis.
“There are homes tailored for different buyers across this region from first-home buyers to upsizers, downsizers and even investors,” says Luke McAuliffe of Luton Properties Gungahlin.
“This region will be ever-growing, so local residents would be pleased to know that its town centres and surrounding suburbs will be improved and built on as it caters to the growing population.”
McAuliffe, a name synonymous with record-breaking sales in the Gungahlin region, says the area has been “a stand-out performer not only in the past six months but the past 12 months”.
“Records have been set in almost every suburb and the overall region record was broken less than 12 months ago,” he says. “Buyers are starting to see the value of the region and are making that move here.”
The Gungahlin region record currently sits at $2.475 million, which was set in November 2020.
Median sale prices in Gungahlin, January – June 2021*
| Suburb | Property type | Median price |
| Gungahlin | Unit | $392,000 |
| Harrison | Unit | $411,250 |
| Franklin | Unit | $435,000 |
| Ngunnawal | Unit | $505,000 |
| Moncrieff | Unit | $555,000 |
| Casey | Unit | $589,000 |
| Casey | House | $650,000 |
| Ngunnawal | House | $650,500 |
| Bonner | House | $795,250 |
| Harrison | House | $828,000 |
| Gungahlin | House | $830,000 |
| Amaroo | House | $832,500 |
| Moncrieff | House | $840,000 |
| Taylor | House | $850,000 |
| Palmerston | House | $865,250 |
| Franklin | House | $880,000 |
| Crace | House | $882,500 |
| Forde | House | $1,090,000 |
| Nicholls | House | $1,250,000 |
*Suburbs with at least 20 sales in the first 6 months of 2021.
Belconnen: Affordable heartland
Population: 101,060
Median house price: $763,500
YoY change: 21.2%
Median unit price: $448,500
YoY change: 4.3%
Clearance rate: 87%
Source: Australian Bureau of Statistics & Domain Group, January-June, 2021
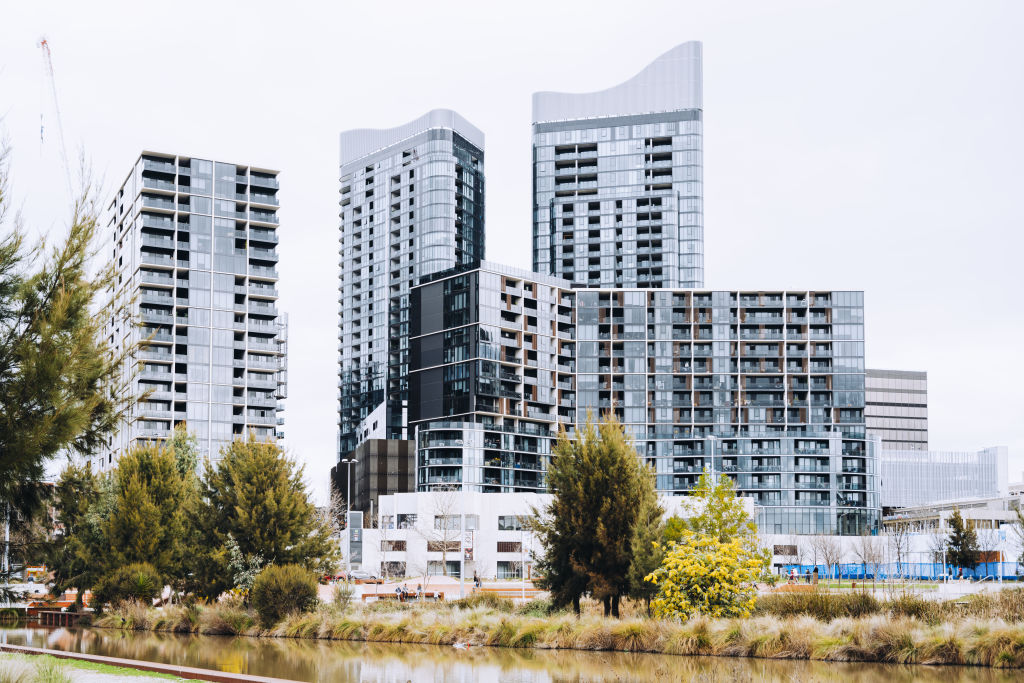
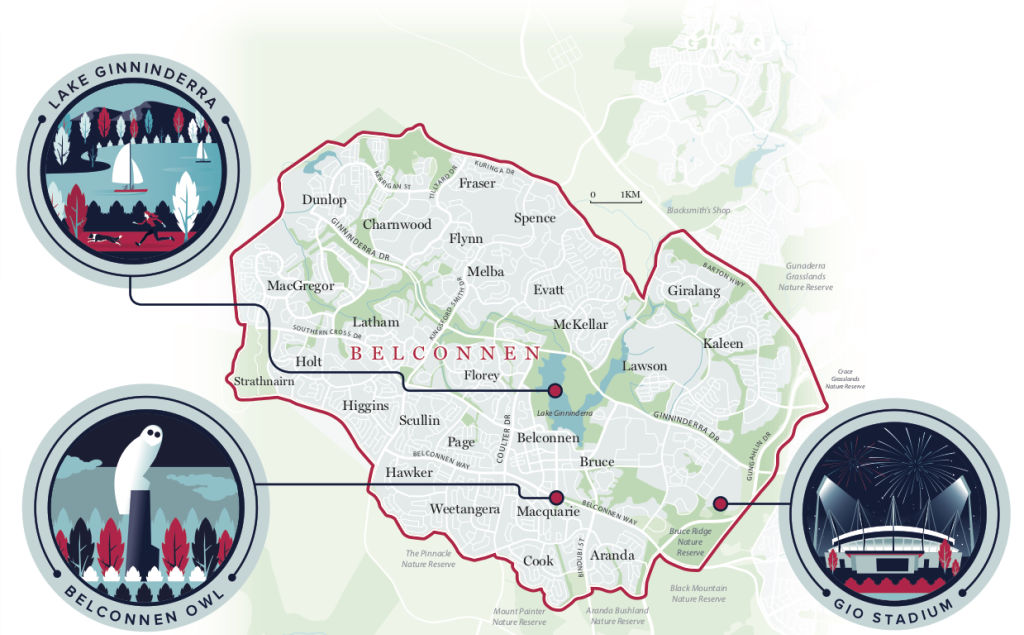
Belconnen, or “Belco” as it’s affectionately known, is dubbed an “affordable heartland” and is an ideal region to raise a family.
Belco is also no stranger to new residents, particularly with high-rise apartment developments and commercial offerings being built across from Lake Ginninderra.
In the six months to June, Belconnen was the most affordable Canberra region in which to purchase a unit, at $448,500.
“While the suburbs in Belconnen cater to families who need a larger block of land, apartments closer to the Westfield Belconnen shopping centre and bordering the lake will suit firsthome buyers or professionals looking for low-maintenance living,” says Matt Sebbens of Blackshaw Belconnen.
“The new mixed-use developments coming up in Belconnen are seeing a lot of footwork around there, which will continue to evolve over the coming years and be a destination for incoming Canberra residents.”
Belconnen’s current residential benchmark sits at $2.26 million, which was reached in May.
The district serves as the capital’s home for sports and study and is where you can find GIO Stadium, the Australian Institute of Sport, the University of Canberra and the Canberra Institute of Technology in the suburb of Bruce.
Median sale prices in Belconnen, January-June 2021*
| Suburb | Property type | Median price |
| Bruce | Unit | $370,000 |
| Belconnen | Unit | $428,750 |
| Lawson | Unit | $570,000 |
| Holt | Unit | $579,000 |
| Charnwood | House | $612,500 |
| Macquarie | Unit | $649,900 |
| Holt | House | $660,000 |
| Macgregor | House | $681,000 |
| Page | House | $712,944 |
| Dunlop | House | $715,000 |
| Florey | House | $735,000 |
| Giralang | House | $750,000 |
| Latham | House | $750,000 |
| Flynn | House | $795,000 |
| Evatt | House | $800,000 |
| Kaleen | House | $922,500 |
*Suburbs with at least 20 sales in the first six months of 2021.
Inner North: In the heart of it all
Population: 59,095
Median house price: $1.22 million
YoY change: 30.8%
Median unit price: $520,250
YoY change: 7.8%
Clearance rate: 84%
Source: Australian Bureau of Statistics & Domain Group, January-June, 2021
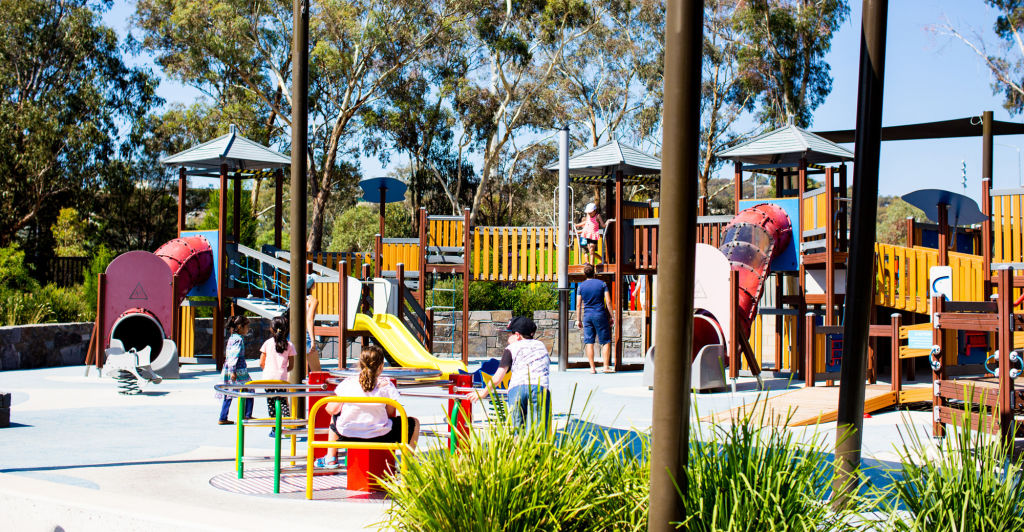
Bordering the city is the Inner North, which has seen a huge amount of development in recent years, transforming it into a vibrant, social gathering place for residents across the capital.
The region is bustling with cafes, restaurants and bars in suburbs like NewActon, Braddon, Dickson and Campbell, just to name a few.
It’s one of the most established parts of Canberra, built in accordance with Walter Burley Griffin’s design and vision for the capital.
Steeped in history, it houses the re-use of surplus military buildings after World War II, called Tocumwal houses, which line the streets of O’Connor and Ainslie.
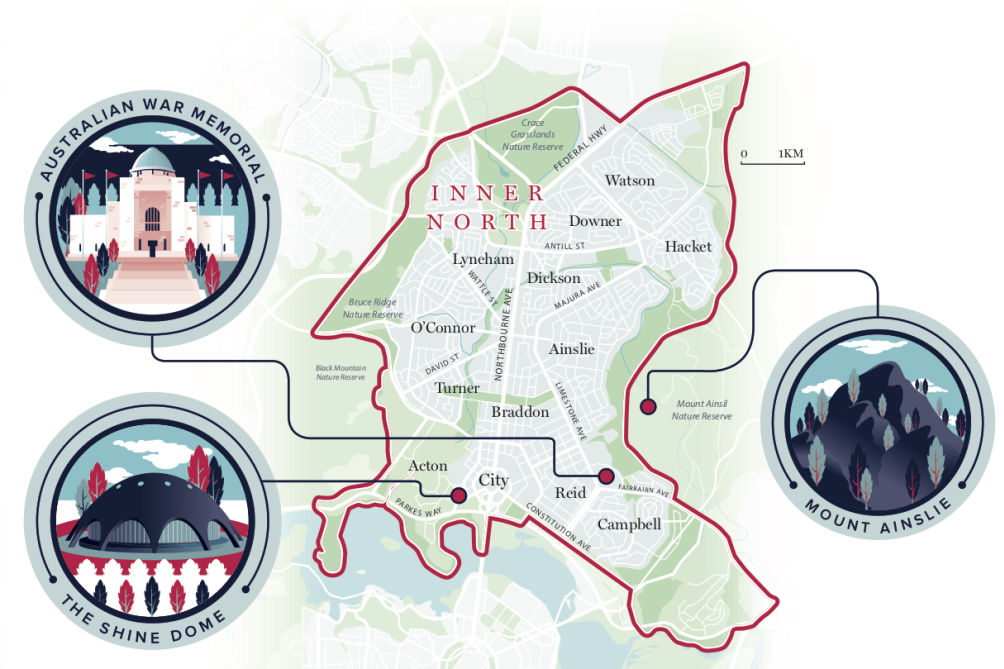
Now, with new residential apartments being built all along Northbourne Avenue, coupled with the light rail corridor, it’s easy to see why this region has become a hot spot for modern property hunters.
The Inner North entered the million-dollar club in the six months to June, when its median house price reached $1.22 million.
The region record was also broken during this period when a Turner property sold for $4.15 million in May.
“Inner North people love living here because you’re in the thick of the city, but you’re also close to nature,” says JWLand project marketing manager Nick Babic.
“The premium end of the market has seen other prospective buyers look to the Inner North … including firsthome buyers and professionals who want an apartment … and young families who opt to purchase townhouses close to the city.”
Median sale prices in Inner North, January – June 2021*
| Suburb | Property type | Median price |
| Lyneham | Unit | $425,000 |
| Watson | Unit | $431,250 |
| O’Connor | Unit | $468,750 |
| Reid | Unit | $476,500 |
| Dickson | Unit | $525,500 |
| Braddon | Unit | $542,000 |
| Turner | Unit | $552,500 |
| City | Unit | $560,000 |
| Watson | House | $945,000 |
| Lyneham | House | $1,066,000 |
| Downer | House | $1,136,000 |
| Ainslie | House | $1,305,000 |
| O’Connor | House | $1,550,000 |
| Campbell | House | $1,565,000 |
*Suburbs with at least 20 sales in the first 6 months of 2021.
Inner South: Prestige and power
Population: 30,412
Median house price: $1.7 million
YoY change: 28.3%
Median unit price: $634,000
YoY change: 20.8%
Clearance rate: 83%
Source: Australian Bureau of Statistics & Domain Group, January-June, 2021
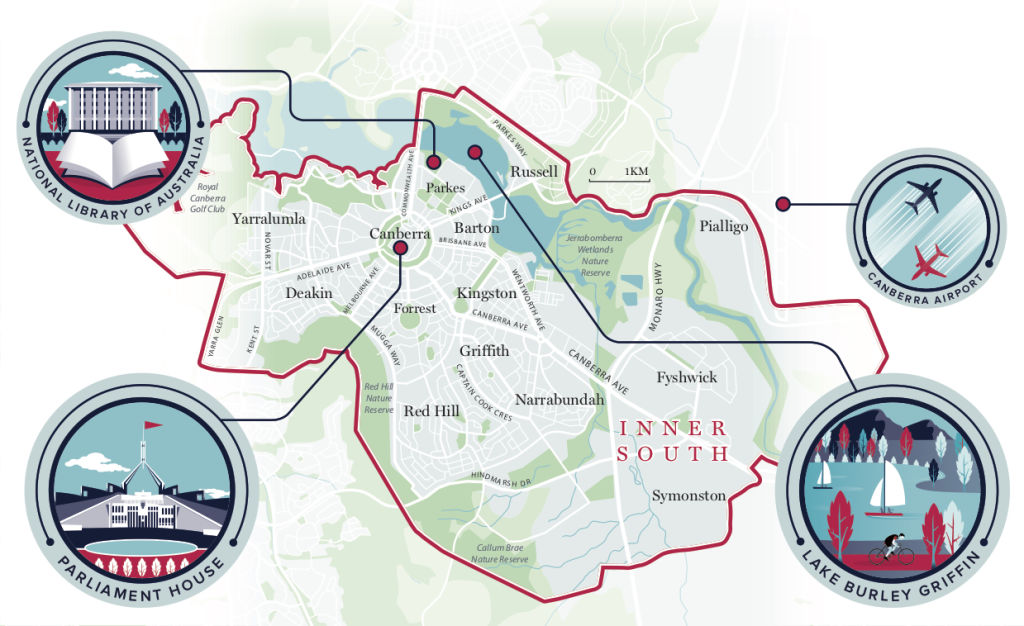
The Inner South is where Australia’s heart of democracy lives, hosting Parliament House and almost 80 embassies.
With a number of national museums and galleries, including the National Museum of Australia and the National Portrait Gallery of Australia, there is no shortage of cultural pursuits to enjoy, easily paired with brunch or an afternoon picnic by Lake Burley Griffin.
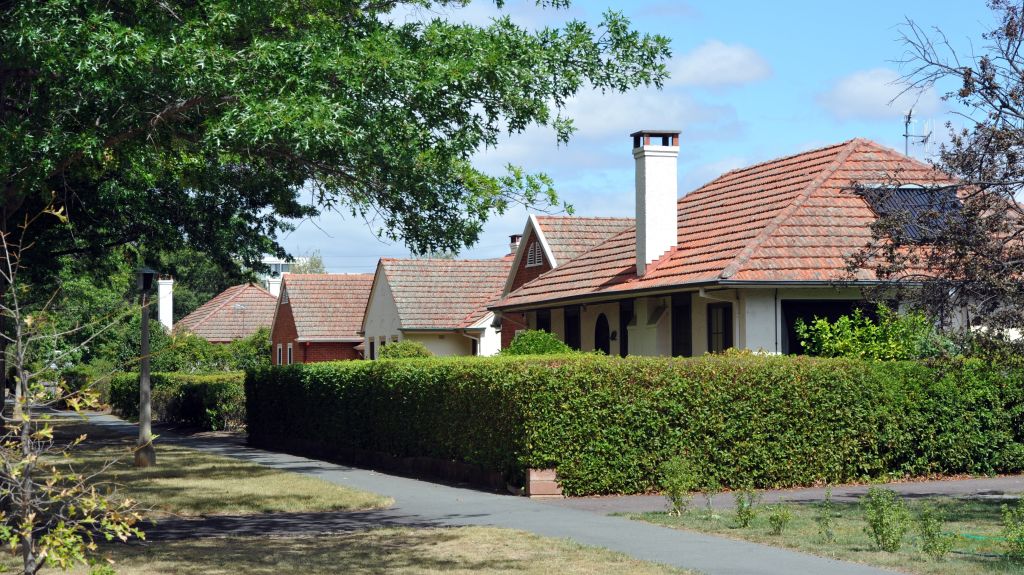
Like the Inner North, the Inner South is also one of the territory’s oldest regions. It pays homage to the past in a number of its suburbs with heritage-listed homes and the signature red-brick ’60s designs, which began or still exist as “govvies” (government-built homes).
The region is home to some of Canberra’s most prestigious neighbourhoods and the coveted “Golden Mile” along Mugga Way in Forrest and Red Hill.
The district is also the most expensive in Canberra in which to purchase a house, with a median of $1.7 million.
“You just have to drive through these suburbs to see the tree-lined streets, neatly trimmed hedges and gated homes to realise how unique it is,” says Wayne Harriden of Independent Project Marketing.
“It’s always had this prestige card about it; the houses in the Inner South are on big blocks of land, which are hard to find these days … people pay a premium just to live there.”
The city’s top schools reside here too, including Canberra Grammar and Canberra Girls Grammar
Median sale prices in Inner South, January – June 2021*
| Suburb | Property type | Median price |
| Griffith | Unit | $485,000 |
| Narrabundah | Unit | $510,000 |
| Kingston | Unit | $650,000 |
| Barton | Unit | $705,000 |
| Forrest | Unit | $859,500 |
| Narrabundah | House | $1,225,000 |
| Yarralumla | House | $2,000,000 |
*Suburbs with at least 20 sales in the first 6 months of 2021.
Woden Valley: There’s a lot to like
Population: 36,942
Median house price: $1.21 million
YoY change: 34.4 %
Median unit price: $465,000
YoY change: -4.1%
Clearance rate: 86%
Source: Australian Bureau of Statistics & Domain Group, January-June, 2021
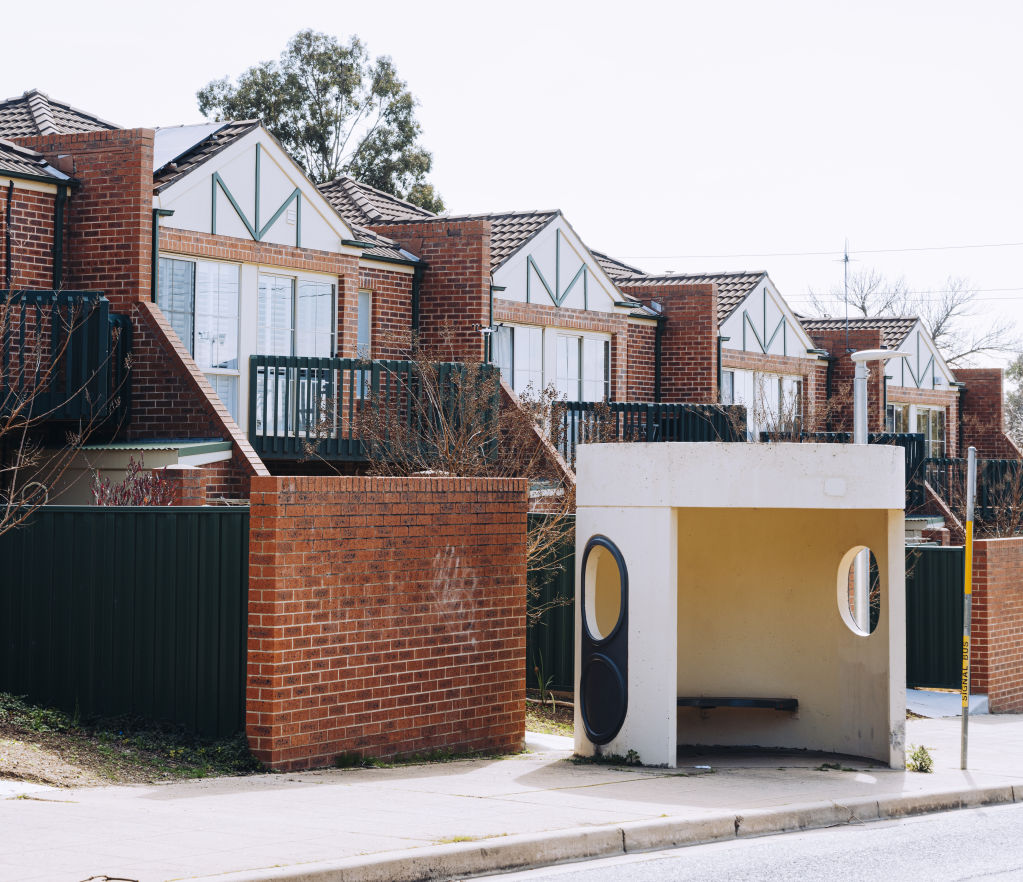
Over recent years, Woden Valley has had a much-needed injection of life.
The heart of the region is the Woden Town Centre and, thanks to the hip Bradley Street dining precinct, the area has become a sought-after neighbourhood for many property hunters, from growing families to corporate professionals.
When Geocon head of sales Adam Morgan heard the median house price in the region had surpassed $1 million dollars in the six months to June, the born-and-bred Woden Valley resident wasn’t surprised.
The region had the strongest median house price growth of all Canberra regions, up 34.4 per cent to $1.21 million.
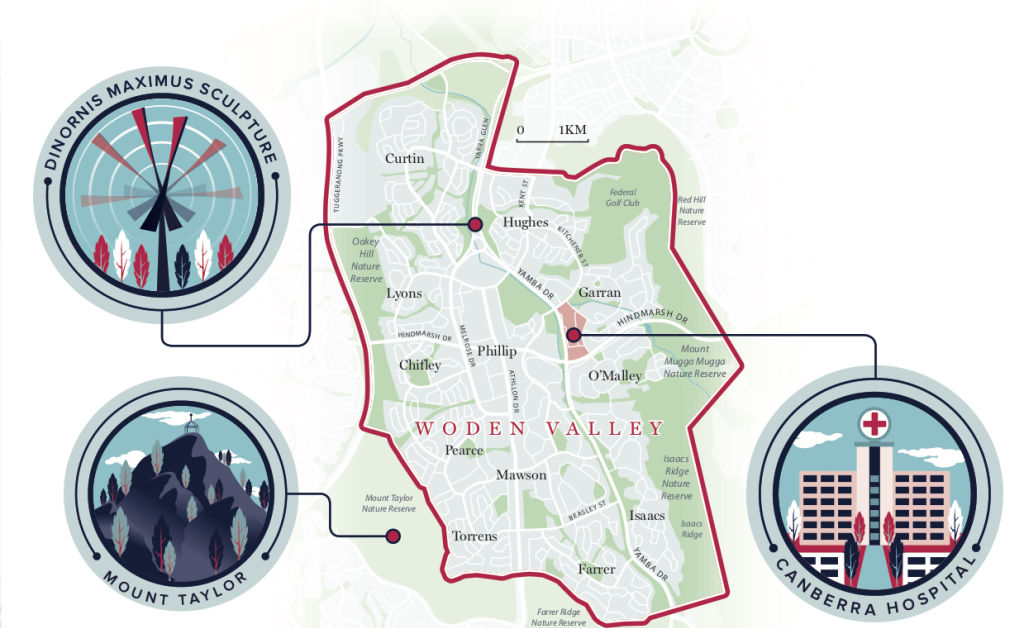
“The Inner North and Inner South have held the mantle as having the highest prices in Canberra but Woden Valley is the next best thing from there,” Morgan says. “People have come to realise the livability of the area.”
But while the region’s housing market has joined the million-dollar club, Morgan says, Woden Valley also offers properties that are on the more affordable side.
“There have been new developments near Woden Town Centre to cater to the demand of buyers wanting to get into the [area] … and these developments offer that affordable price tag but not at the expense of amenities and location,” he says.
Median sale prices in Woden Valley, January – June 2021*
| Suburb | Property type | Median price |
| Phillip | Unit | $413,500 |
| Mawson | Unit | $512,500 |
| Mawson | House | $1,000,000 |
| Lyons | House | $1,115,000 |
| Hughes | House | $1,200,000 |
| Farrer | House | $1,210,000 |
| Curtin | House | $1,320,000 |
| Garran | House | $1,452,500 |
*Suburbs with at least 20 sales in the first 6 months of 2021.
Weston Creek: The quiet achiever
Population: 23,353
Median house price: $892,500
YoY change: 24%
Clearance rate: 95%
Note: Unit median price is not available for Weston Creek due to low volume of unit sales in the first 6 months of 2021
Source: Australian Bureau of Statistics & Domain Group, January-June, 2021
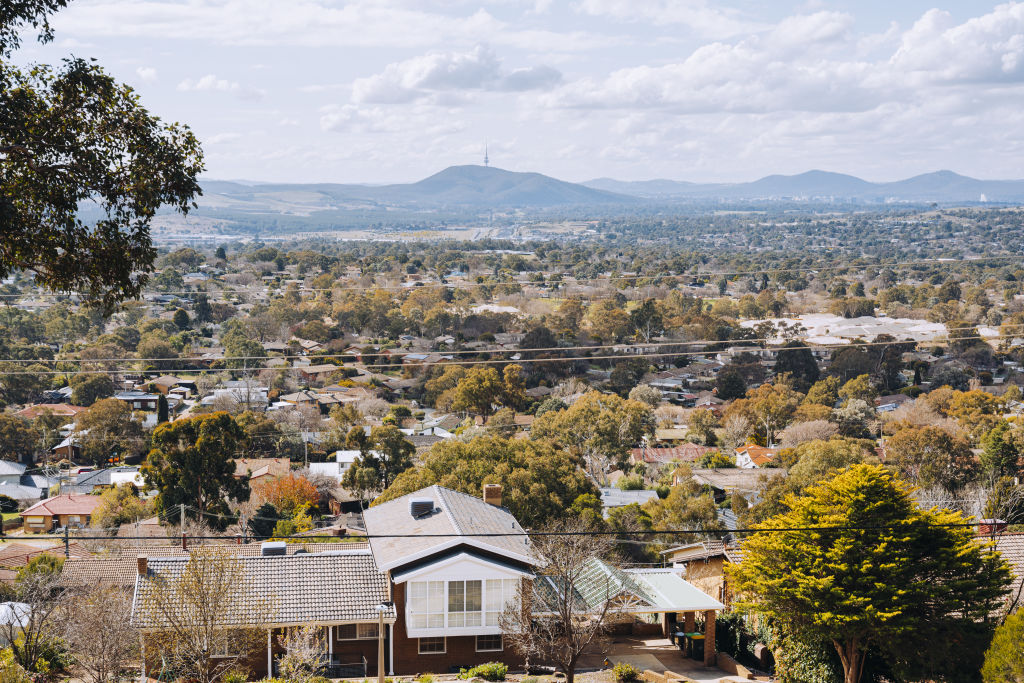
Weston Creek could be best described as one of Canberra’s most resilient regions, having borne the brunt of the 2003 Canberra bushfires.
After nearly 500 homes were affected by the fires, the region has bounced back and established itself as one of the capital’s quiet achievers.
“There’s been a lot of regrowth and Weston Creek has really trumped through it,” says Brett Hayman of Hayman Partners.
“Now, almost two decades later, the region has strived to rebuild itself with the amenities on offer and the quality of properties available.”
Weston Creek’s auction market recorded the highest clearance rate of all Canberra regions at 95 per cent for the six months to June.
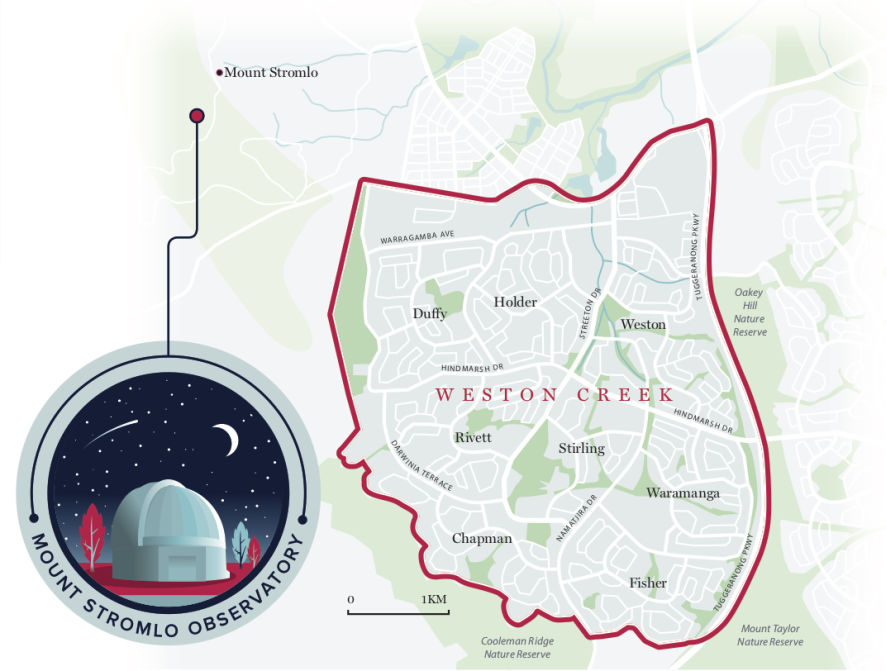
Hayman says he wasn’t surprised by the result, noting that a handful of suburbs have been popular in recent months.
“Houses that were selling for $700,000 are now selling for $100,000 more because of that demand and I think we’ll continue to see that growth here,” he says.
“The suburb of Rivett has been quite a stand-out performer in recent years, with house prices increasing with every sale.
“The successful rate of auctions is also supported by the region’s more premium suburb, Chapman, [where] sale prices are between the $1.5 million and $2 million mark.”
Median sale prices in Weston Creek, January – June 2021*
| Suburb | Property type | Median price |
| Rivett | House | $790,000 |
| Holder | House | $840,000 |
| Fisher | House | $847,500 |
| Chapman | House | $1,125,000 |
*Suburbs with at least 20 sales in the first 6 months of 2021.
Molonglo Valley: New and booming
Population: 8568
Median house price: $885,000
YoY change: 4.7%
Median unit price: $460,000
YoY change: 4.1%
Clearance rate: 73%
Source: Australian Bureau of Statistics & Domain Group, January-June, 2021
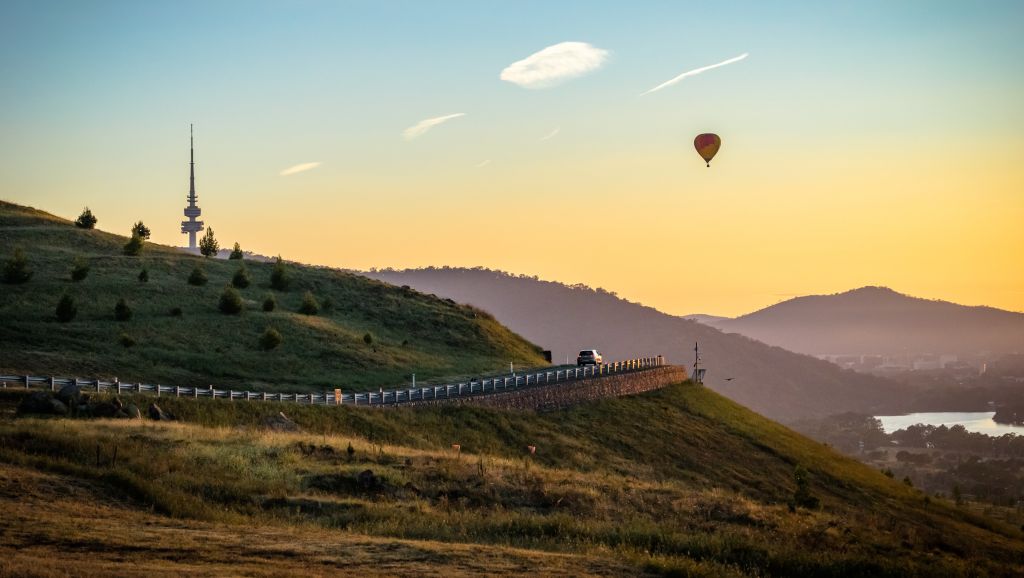
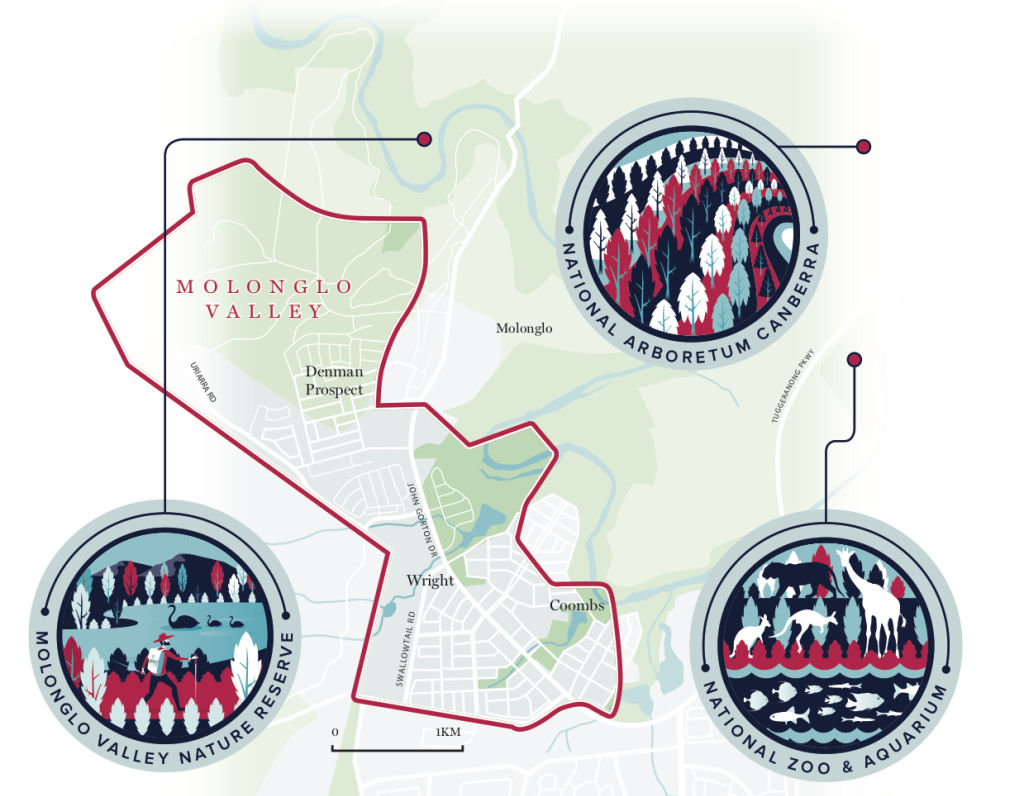
Molonglo Valley is Canberra’s newest district. While it’s still very much under development, many people already call its suburbs of Wright, Coombs and Denman Prospect home.
Its convenient location has been a drawcard for many property buyers, says Frank Rasouli of Illustrated Properties.
“It’s in a central location only minutes away from Belconnen, Woden and Canberra CBD – a 15-minute drive, at most,” he says.
“And because it’s a new region, it’s surrounded by newly-built homes, schools and shops, so buyers who have been looking for a move-in ready home would find properties in the Molonglo Valley region to suit their needs.”
The region’s overall record was broken in August when a five-bedroom home in Coombs sold for $3.25 million, the first $3 million sale in the suburb.
“There’s been a great shortage of stock across all of Canberra, so buyers are digging deeper into their pockets to secure a home, and that’s what we saw with Molonglo Valley’s record,” says Rasouli.
The region has rapidly evolved over the years and will continue to grow with the suburbs of Molonglo and Whitlam under construction. Eventually, Molonglo Valley is expected to house 60,000 new residents across seven suburbs over the next few decades.
Median sale prices in Molonglo Valley, January – June 2021*
| Suburb | Property type | Median price |
| Wright | Unit | $431,000 |
| Coombs | Unit | $540,100 |
| Denman Prospect | Unit | $549,450 |
| Coombs | House | $815,000 |
| Denman Prospect | House | $815,000 |
| Wright | House | $982,500 |
*Suburbs with at least 20 sales in the first 6 months of 2021.
Tuggeranong: Family-friendly zone
Population: 85,034
Median house price: $753,000
YoY change: 19.3%
Median unit price: $520,000
YoY change: 14.3%
Clearance rate: 90%
Source: Australian Bureau of Statistics & Domain Group, January-June, 2021
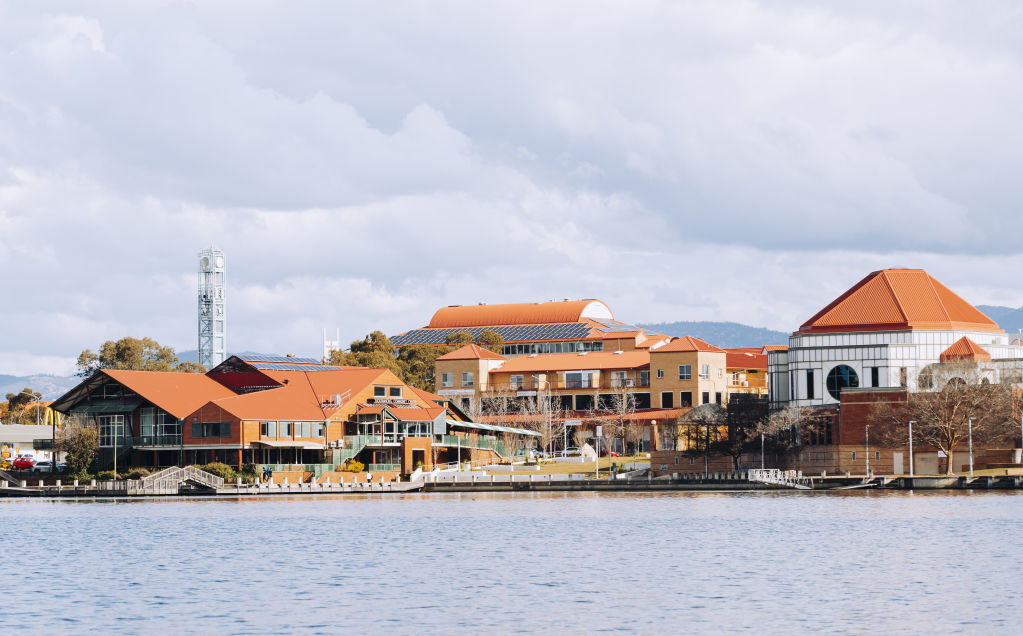
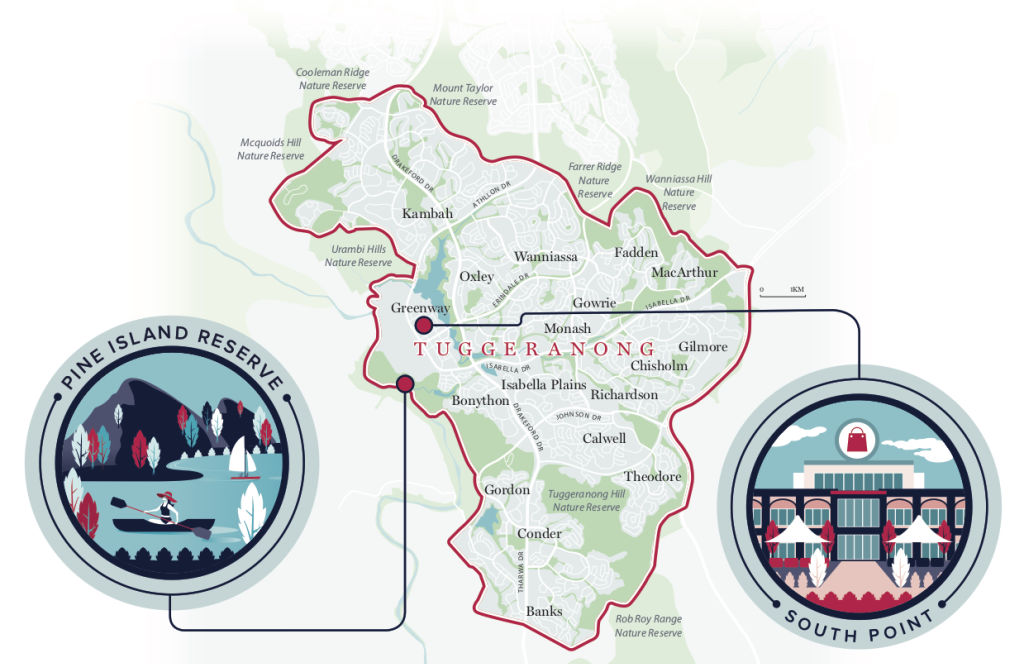
Tuggeranong is Canberra’s most southern district and is any nature lover’s oasis.
With the Brindabella Range providing a stunning mountain backdrop and Lake Tuggeranong at the heart of the region, this area is one worth calling home, sweet home.
Before it was gazetted in 1966, cave paintings and Indigenous artefacts were discovered in the area that confirmed the original occupants, the Ngunnawal people, have inhabited the land for more than 21,000 years.
Today, more than 85,000 Canberrans call it home, and they’re mostly families, says Will Honey of The Property Collective.
“Tuggeranong is often regarded as the more affordable region and that’s what’s drawn a lot of buyers to purchase here,” he says.
“Buyers ranging from first-home buyers to upsizers are looking here because you get more value for money.”
In the six months to June, Tuggeranong was the most affordable Canberra region in which to purchase a house, with a median of $753,000.
“A lot of locals would purchase their first home here and, when it’s time to upsize, they upsize in Tuggeranong,” Honey says. “A lot of existing residents move within the region. It becomes a community region where everyone knows everyone.”
Tuggeranong’s region record currently sits at $1.715 million, set in August when a Conder property recently sold via online auction.
Median sale prices in Tuggeranong, January – June 2021*
| Suburb | Property type | Median price |
| Greenway | Unit | $420,000 |
| Theodore | House | $682,325 |
| Isabella Plains | House | $690,000 |
| Banks | House | $705,000 |
| Richardson | House | $705,000 |
| Gordon | House | $715,000 |
| Calwell | House | $760,000 |
| Conder | House | $761,000 |
| Wanniassa | House | $778,000 |
| Monash | House | $787,500 |
| Kambah | House | $794,000 |
| Chisholm | House | $802,000 |
*Suburbs with at least 20 sales in the first 6 months of 2021.
Queanbeyan: Best of both worlds
Population: 63,771
Median house price: $750,000
YoY change: 15.4%
Median unit price: $325,000
YoY change: 4.4%
Clearance rate: 77%
Source: Australian Bureau of Statistics & Domain Group, January-June, 2021
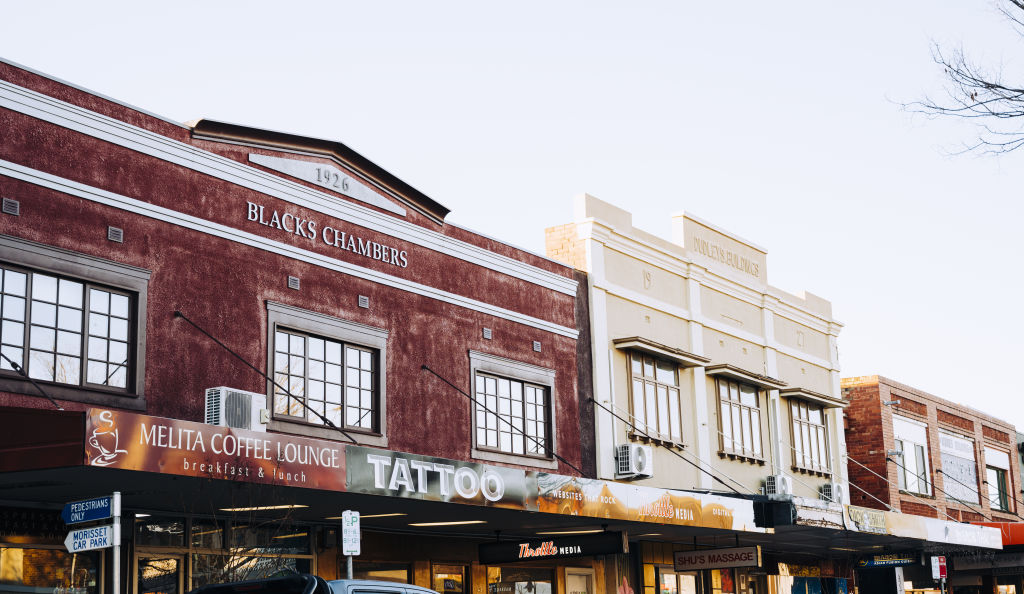
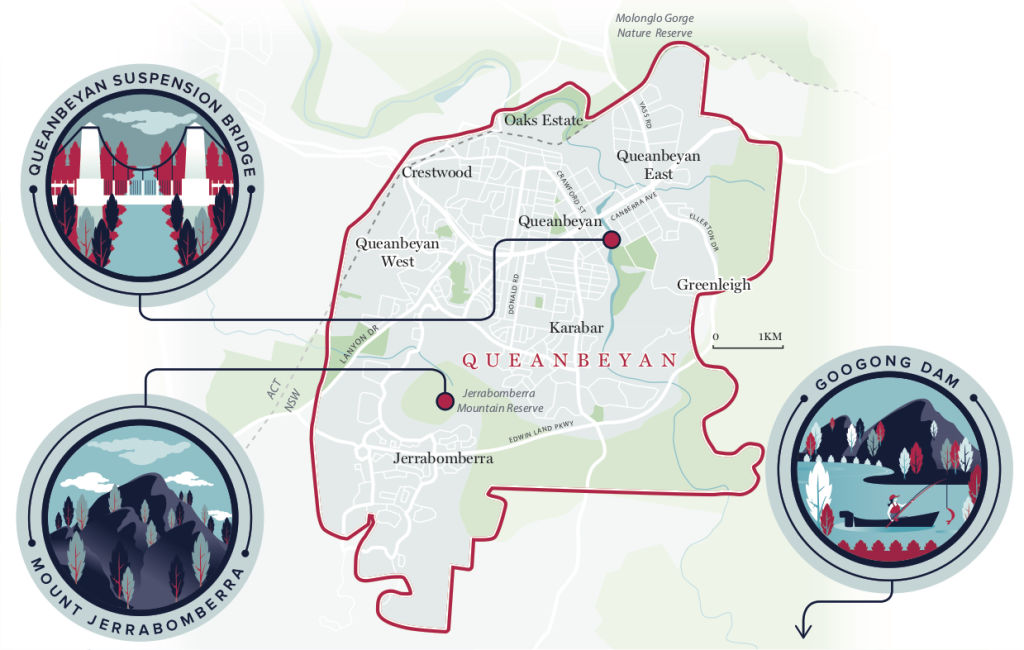
Resting alongside the nation’s capital is the NSW city of Queanbeyan, otherwise known as “Quangers”.
It’s rich in heritage, abounds in historic buildings and exudes an old-town feel. With house and unit prices in the nation’s capital rising, buyers are often looking across the border for some respite.
While the ACT has a median house price above $1 million, Queanbeyan’s is $750,000. Similarly, in the unit market, buyers would be better off buying a unit in Queanbeyan for $325,000 as opposed to $504,217 in the ACT.
Plus, there are differing stamp duty exemptions in NSW for first-home buyers compared to the ACT.
Queanbeyan first-home buyers have access to a $10,000 grant for new properties bought for less than $750,000.
The best description of Queanbeyan’s lifestyle could be summed up as “country living, city benefits”. “You get the best of both worlds,” says Gavin Van Zyl of White Rhino Property.
“There are heritage homes in suburbs across the region but in the new suburbs … you get newly built, bigger homes in spades.”
Van Zyl says that, while the region offers more affordable properties, Googong township, in particular, is starting to become a “premium area”.
He also says buyers purchasing in the here will “not have to sign a 99- year lease on a property, as required in the ACT”.
Median sale prices in Queanbeyan, January-June 2021*
| Suburb | Property type | Median price |
| Crestwood | Unit | $260,000 |
| Queanbeyan East | Unit | $280,000 |
| Queanbeyan | Unit | $329,000 |
| Queanbeyan East | House | $530,000 |
| Queanbeyan West | House | $580,000 |
| Queanbeyan | House | $605,000 |
| Crestwood | House | $697,750 |
| Karabar | House | $710,000 |
| Googong | House | $785,000 |
| Jerrabomberra | House | $895,000 |
*Suburbs with at least 20 sales in the first 6 months of 2021.
We recommend
We thought you might like
States
Capital Cities
Capital Cities - Rentals
Popular Areas
Allhomes
More
