How has Canberra's property market changed over the past 2 decades?
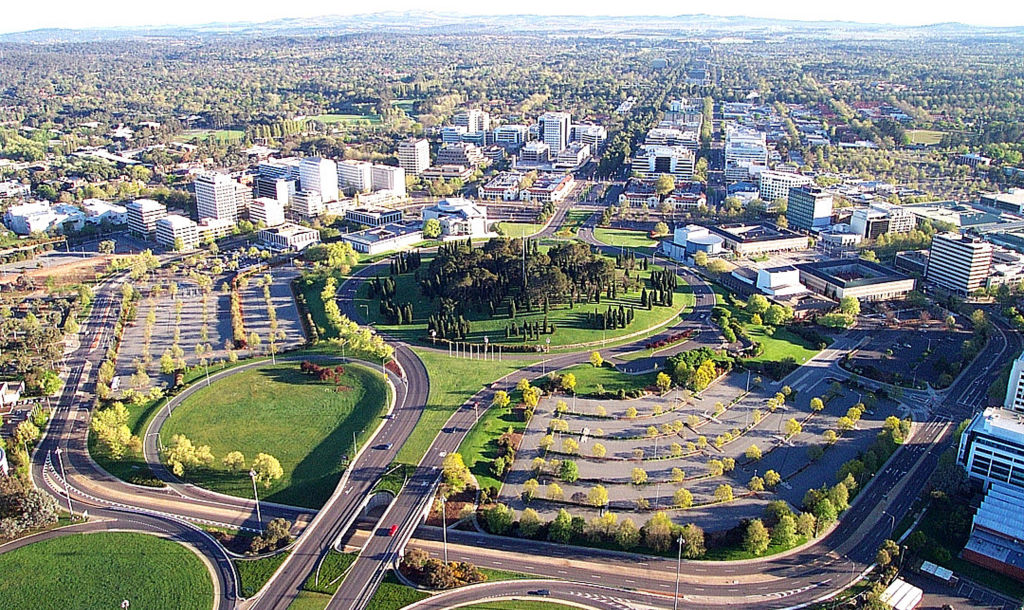
In 20 years, from prices to wish lists, from how we purchase to affordability, the Canberra residential landscape has morphed since the turn of the century.
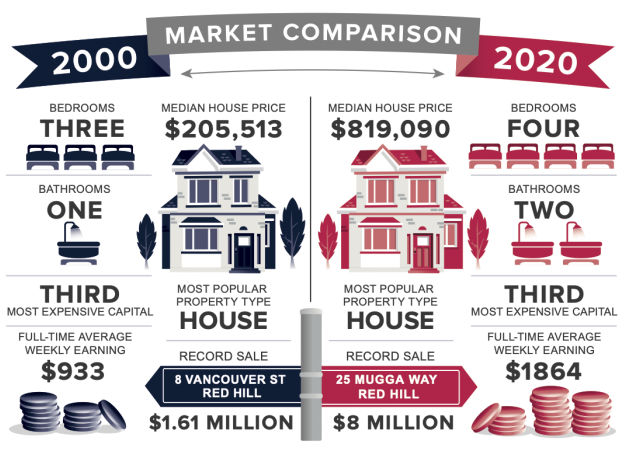
Apartment living may be on the rise, but there has been little deviation on the type of home most frequently sold with transactional data revealing that the most common dwelling type sold in 2020 was a house, the same in 2000.
But the size of homes has undergone a dramatic transformation, with Canberrans keen on multi-bedroom houses. The average number of bedrooms has increased from three to four, and bathrooms from one to two.
Census data reveals there are more bedrooms than people to fill them, with the number of residents per dwelling declining over time. This may perhaps reflect our desire for additional space, or the lack of downsizing from empty-nesters.
However, the shift towards higher density living is happening, and at quite a rapid pace. In 2000, 68 per cent of the properties transacted were houses (including townhouses), compared to 53 per cent of transactions in the 12 months to June 2020.
Higher-density housing stock has risen from ongoing densification due to changes in planning policies, consumer preferences, lifestyle and affordability constraints.
The way we purchase our homes has also changed with auctions growing in popularity as a selling method. In 2000, roughly 2 per cent of houses were sold by auction. By 2020 this stands at an impressive one-quarter.
For units, the number of sales by auction 20 years ago was negligible, today the proportion remains small at 4 per cent of sales.

There have been many possible disrupters to the Canberra property market over the past 20 years, from the dot.com downturn to the Global Financial Crisis, from the devastation of the 2003 bushfires to the Mr Fluffy loose-filled asbestos scheme, from APRA’s recent credit squeeze to the current pandemic.
Despite this, over the past two decades Canberra has been one of the top-performing capital cities.
The housing market has seen some significant gains over the past 20 years, with house values moving through four distinct growth cycles.
House prices have soared 299 per cent from the end of the past century to mid-2020, producing the second strongest growth behind Melbourne’s 322 per cent. This has provided home owners with a significant wealth boost, although three-fifths of this growth occurred during the first 10 years of this century.
The capital gain for houses over the past two decades equates to a compound annual growth rate of 7.35 per cent.
Twenty years ago, house prices at the time had hit a record $205,513, fast-forward to another new high mid-2020 at $819,090.
Throughout this time there have been very few periods when house prices have fallen annually.
Canberra avoids the big price swings that Sydney experiences, proving slow and steady wins the race for those in the market for the long haul.
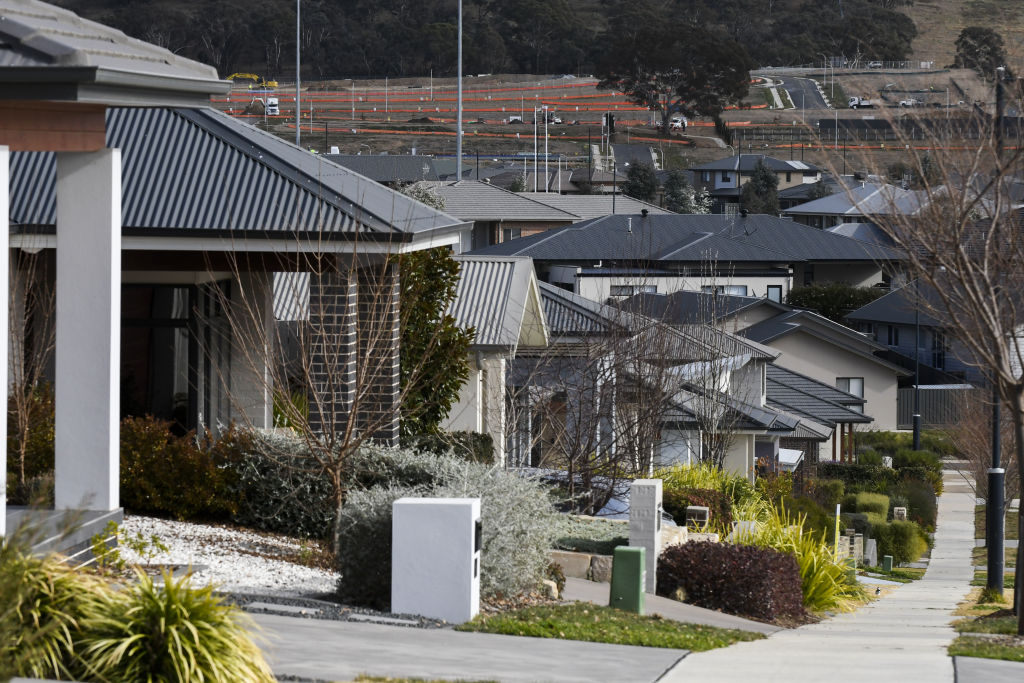
Unit values have increased 190 per cent over the past two decades, although most of the growth occurred in the first 10 years post-2000.
Only one-10th of the increased value occurred in the most recent decade, with the vast majority of price acceleration occurring between 2000 to 2010. The capital gain for units over the past 20 years equates to a compound annual growth rate of 5.61 per cent, from $156,570 in 2000 to $453,750 in mid-2020.
Housing prices have risen at a faster pace than household incomes. The average Canberran’s full-time weekly wage has risen 200 per cent over the past 20 years.
Canberra’s house price-to-income ratio is now tracking at 8.5, compared to 4.2 at the end of 2000. The unit price-to-income ratio, however, is far more favourable in comparison, now at 4.7 compared to 3.2.
While we can get caught up thinking about how much our homes are worth today, or dreaming of purchasing at 2000 prices, imagine what they could be worth by 2040.
Significant wealth has been created for home owners over the past 20 years, and if the same rate of growth is applied to the next 20 years it reveals some eye-watering multimillion-dollar medians.
By the year 2040, based on the compounded annual rate of growth from the past two decades, Canberra’s median house price could reach $3.385 million and unit prices $1.352 million.
However, these are simple extrapolated medians that don’t take into account the variety of factors that can affect price growth, such as demographic, economic or political changes, or even global pandemics.
But just imagine if in 2000 we knew what the median price would be in 2020.
Read more of Allhomes’ 20th anniversary story series here.
We recommend
States
Capital Cities
Capital Cities - Rentals
Popular Areas
Allhomes
More
- © 2025, CoStar Group Inc.


