'Nerve-racking': Canberra's median house price posts steepest decline on record
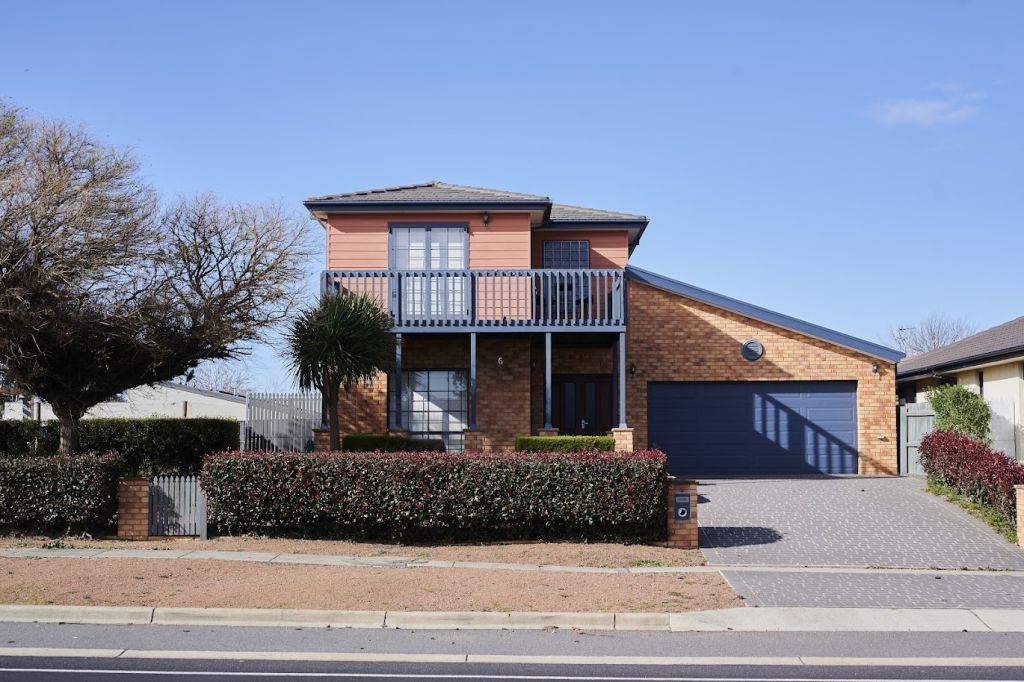
Canberra’s median house price has fallen at the steepest rate on record over the September quarter, but remains the second most expensive capital city in which to purchase a house or unit, new data reveals.
According to the Domain House Price Report, released on Thursday, Canberra’s median house price has dropped by 5.8 per cent over the quarter to $1,096,114, which is the largest decrease of all capital cities. However, it was up 3.8 per cent year-on-year.
Median prices for units in Canberra have also dropped over the quarter, down 4.2 per cent to $572,824 but up 4.6 per cent year-on-year.
Excluding Adelaide, house medians across all other capital cities have also dropped, with Sydney’s median dropping by 5.2 per cent to $1,464,371. It remains the most expensive capital city in which to purchase a house.
| HOUSES | STRATIFIED MEDIAN PRICE | |||||||
| Capital city | Sep-22 | Jun-22 | Sep-21 | Quarterly change | Annual change | Price peak achieved | Prices from peak |
| Sydney | $1,464,371 | $1,544,145 | $1,506,727 | -5.2% | -2.8% | Mar-22 | -8.3% |
| Melbourne | $1,028,452 | $1,075,008 | $1,049,276 | -4.3% | -2.0% | Dec-21 | -6.0% |
| Brisbane | $811,312 | $847,374 | $715,834 | -4.3% | 13.3% | Mar-22 | -4.3% |
| Adelaide | $795,093 | $790,100 | $652,418 | 0.6% | 21.9% | Sep-22 | 0.0% |
| Canberra | $1,096,114 | $1,163,851 | $1,056,067 | -5.8% | 3.8% | Dec-21 | -6.0% |
| Perth | $645,946 | $656,058 | $598,912 | -1.5% | 7.9% | Jun-22 | -1.5% |
| Hobart | $741,275 | $760,783 | $682,208 | -2.6% | 8.7% | Mar-22 | -3.3% |
| Darwin | $623,819 | $649,178 | $652,561 | -3.9% | -4.4% | Dec-13 | -8.1% |
| Combined capitals | $1,022,194 | $1,065,186 | $999,620 | -4.0% | 2.3% | Mar-22 | -4.9% |
What’s happening in Canberra is mirroring a broader national trend where high-performing capital cities are experiencing the biggest downturn, Domain chief of research and economics Dr Nicola Powell said.
“House prices across combined capitals are now 4.9 per cent below the March 2022 price peak, down by about $53,000 … they would need to fall by a further 21.3 per cent to ease all the growth seen during the pandemic boom,” she said.
Canberra’s price peaked in December 2021 and the most recent data revealed the capital is 6 per cent below its apex price, down about $70,000.
“When you look at all the capital cities, Sydney, Melbourne and Canberra are coming up as the weakest as they have fallen the most from their respective price peaks,” Powell said.
“Markets [with] a higher price mean that households have a higher debt, which is only further being impacted by the Reserve Bank hiking interest rates by the most aggressive amount since 1994.”
| UNITS | STRATIFIED MEDIAN PRICE | |||||||
| Capital city | Sep-22 | Jun-22 | Sep-21 | Quarterly change | Annual change | Price peak achieved | Prices from peak |
| Sydney | $754,812 | $778,884 | $799,508 | -3.1% | -5.6% | Dec-21 | -5.7% |
| Melbourne | $561,121 | $580,333 | $574,136 | -3.3% | -2.3% | Dec-21 | -5.7% |
| Brisbane | $451,905 | $451,905 | $409,129 | 0.0% | 10.5% | Jun-22 (held at record QoQ) | 0.0% |
| Adelaide | $416,410 | $406,254 | $351,208 | 2.5% | 18.6% | Sep-22 | 0.0% |
| Canberra | $572,824 | $598,095 | $547,539 | -4.2% | 4.6% | Jun-22 | -4.2% |
| Perth | $356,755 | $365,674 | $366,874 | -2.4% | -2.8% | Jun-14 | -15.5% |
| Hobart | $549,135 | $533,667 | $538,520 | 2.9% | 2.0% | Dec-21 | -2.2% |
| Darwin | $364,192 | $382,937 | $360,493 | -4.9% | 1.0% | Mar-16 | -25.1% |
| Combined capitals | $599,082 | $615,054 | $611,243 | -2.6% | -2.0% | Dec-21 | -3.9% |
Steve Lowe of Agent Team Canberra said he had noticed a significant drop in prices in the market and “a huge decline in demand, urgency, affordability and borrowing capacity”.
“A new buyer in the market today can borrow $300,000 less than they could this time last year, so that amount has been taken out of the marketplace, because money isn’t cheap anymore,” he said.
“Serviceability is never going to be the same as it was during COVID when we had [low] interest rates, prices sky-rocketed because money was super affordable, and anybody with a job could get $1.5 million from the bank.
“Now, we have had to change things, so now we no longer hope or expect a result at auction … if we get any inquiries we treat them as our only buyer.”
In September, Canberra recorded a 57.3 per cent clearance rate for homes successfully selling at auction.
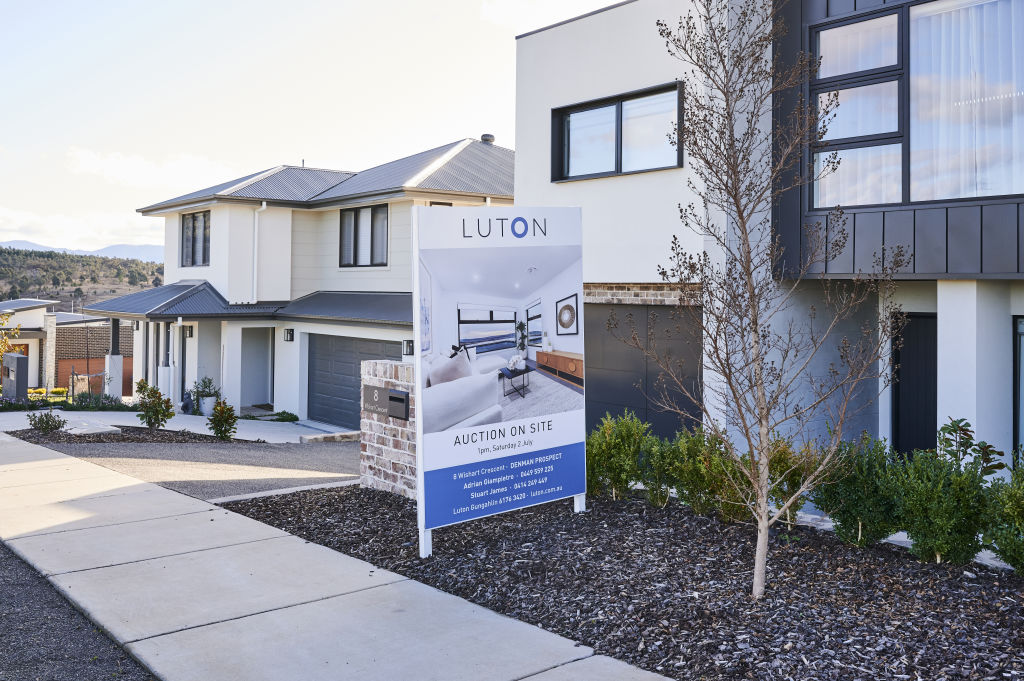
Despite the declining clearance rates, seller Sarah Staines said she is confident her unique home would yield a good result in today’s market.
Staines had been looking for a specific type of home for two years in a very competitive location, and had decided not to sell her current property until she had found one.
“We would have received a higher sale price if we sold 12 months ago when the market was high, but we were not ready to go to market then. We are buying and selling in the same market now so it’s all relative,” she said.
With her house set to go to auction, Staines was “confident that it will go to the right buyer for the right sale price”.
“Auctions are always nerve-racking but we believe that we have a realistic expectation of what our property is worth in the current market conditions,” she said.
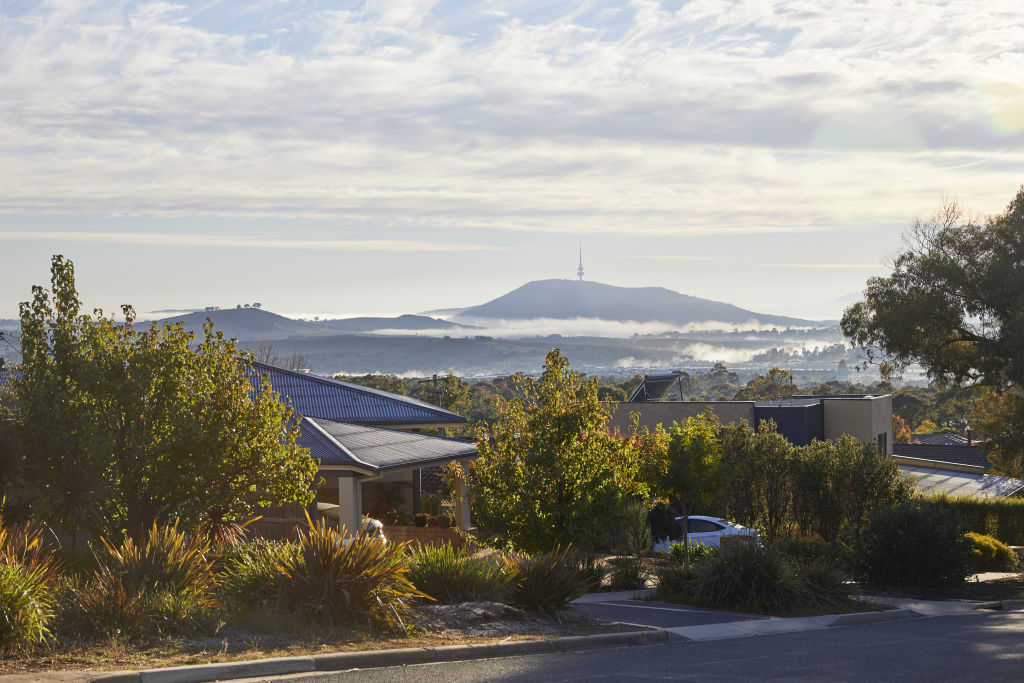
There have still been successful sales of both bottom- and top-end homes selling in the market, especially with suburb records set in O’Connor, and the overall Canberra record being broken last month, said Andrew Chamberlain of Blackshaw Manuka.
“There was a lot of activity in the lower end of the market … the support around first-home buyers meant there was a huge increase in that activity, which may have skewed the median a bit,” he said.
“A nearly 6 per cent decrease in the median also doesn’t mean there is a decrease in the value of your specific piece of real estate.
“However, I don’t think these numbers come as any surprise to anyone following the market’s dramatic growth.”
States
Capital Cities
Capital Cities - Rentals
Popular Areas
Allhomes
More

