Census 2016: The Canberra suburbs with the largest houses and most townhouses

In what suburbs will you have the best chance of finding a big house, a townhouse or maybe even a houseboat?
The answers can be found in the 2016 census data.
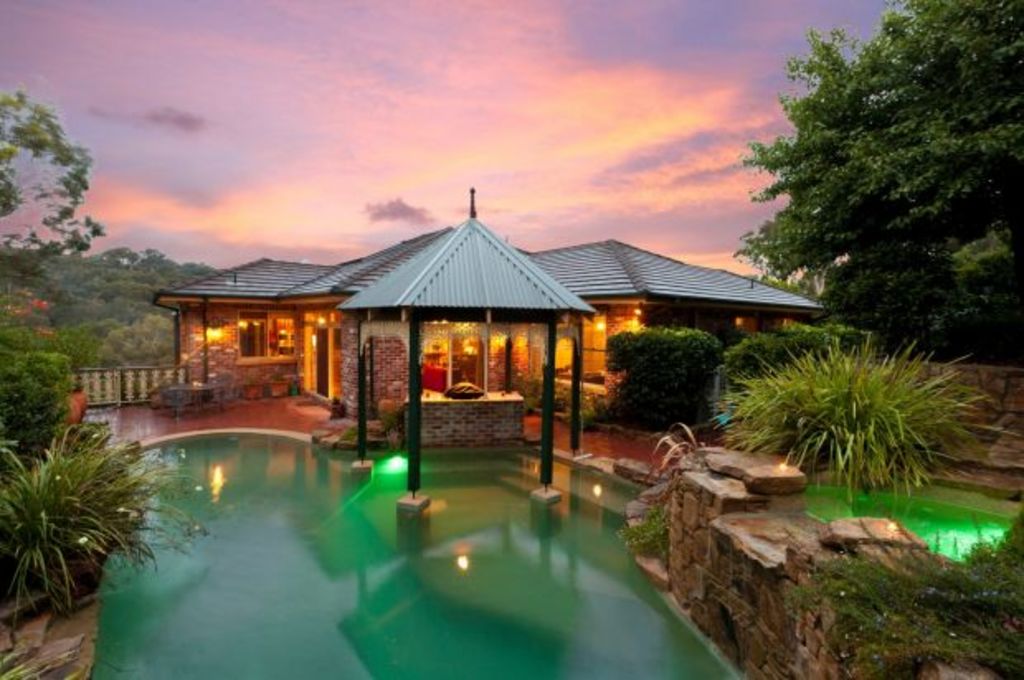
Forrest, Red Hill and Yarralumla are known for their mansions, but data shows you’ll have a better chance of finding a large family home in the outer suburbs.
Fadden, Macarthur, Forde, Nicholls and Chapman were among the suburbs with the highest proportion of homes with four or more bedrooms.
!function(e,t,s,i){var n=”InfogramEmbeds”,o=e.getElementsByTagName(“script”),d=o[0],r=/^https:/.test(e.location)?”https:”:”https:”;if(/^/{2}/.test(i)&&(i=r+i),window[n]&&window[n].initialized)window[n].process&&window[n].process();else if(!e.getElementById(s)){var a=e.createElement(“script”);a.async=1,a.id=s,a.src=i,d.parentNode.insertBefore(a,d)}}(document,0,”infogram-async”,”//e.infogram.com/js/dist/embed-loader-min.js”);
It’s no surprise embassy-dominated O’Malley topped the list – 81.44 per cent of homes here had at least four bedrooms, and more than half of those had at least five.
The Tuggeranong suburb of Fadden wasn’t far behind. Almost 73 per cent of Fadden homes had at least four bedrooms, while Forde, Macarthur, Chapman and Nicholls all topped 65 per cent.
By contrast, in Canberra’s most expensive suburb, Forrest, only 29.54 per cent of properties had more than four bedrooms.
Forrest homes were also more likely to be an apartment or a townhouse rather than a detached dwelling.
Just 319 Forrest properties, or 38.25 per cent of homes, were identified as a “separate house” in the blue-chip suburb and more than 40 per cent were apartments.
- Related: Canberra shifting form houses to units
- Related: Canberra suburbs with the highest mortgages
- Related: More Canberrans seek townhouse living
Those on the market for one of Canberra’s tightly held townhouses may also need to cast a wider net.
Greenway had the highest proportion of townhouses among Canberra’s established suburbs (48.74 per cent).
!function(e,t,s,i){var n=”InfogramEmbeds”,o=e.getElementsByTagName(“script”),d=o[0],r=/^https:/.test(e.location)?”https:”:”https:”;if(/^/{2}/.test(i)&&(i=r+i),window[n]&&window[n].initialized)window[n].process&&window[n].process();else if(!e.getElementById(s)){var a=e.createElement(“script”);a.async=1,a.id=s,a.src=i,d.parentNode.insertBefore(a,d)}}(document,0,”infogram-async”,”https://e.infogram.com/js/dist/embed-loader-min.js”);
You could also try your luck in Ngunnawal. While there was a lower percentage of townhouses (33.55 per cent) it’s a big suburb and home to 1395 townhouses.
Ngunnawal is also a good place for downsizers to begin their search for one of Canberra’s elusive single-level townhouses. There were 998 properties identified as single-level townhouses in the census – more than any other Canberra suburb.
There were not a lot of occupied granny flats in the nation’s capital on census night. Just 0.15 per cent or 241 dwellings were identified as a “flat or apartment attached to a house”.
A total of 50 of these were in Fisher, 23 were in Waramanga and 20 were in Watson.
The most under-represented housing types in the ACT were caravans (0.03 per cent), houses “attached to a shop, office, etc” (0.03 per cent) and cabins or houseboats (0.08 per cent).
Presumably the 121 Symonston dwellings in this category were cabins in the suburb’s Sundown Village.
However the four homes in Melba and the three in Evatt described as a cabin or houseboat are not as easy to pinpoint – no sightings of houseboats have been reported at Ginninderra Creek.
We recommend
We thought you might like
States
Capital Cities
Capital Cities - Rentals
Popular Areas
Allhomes
More


