Does Canberra's property market slow in the lead-up to an election?

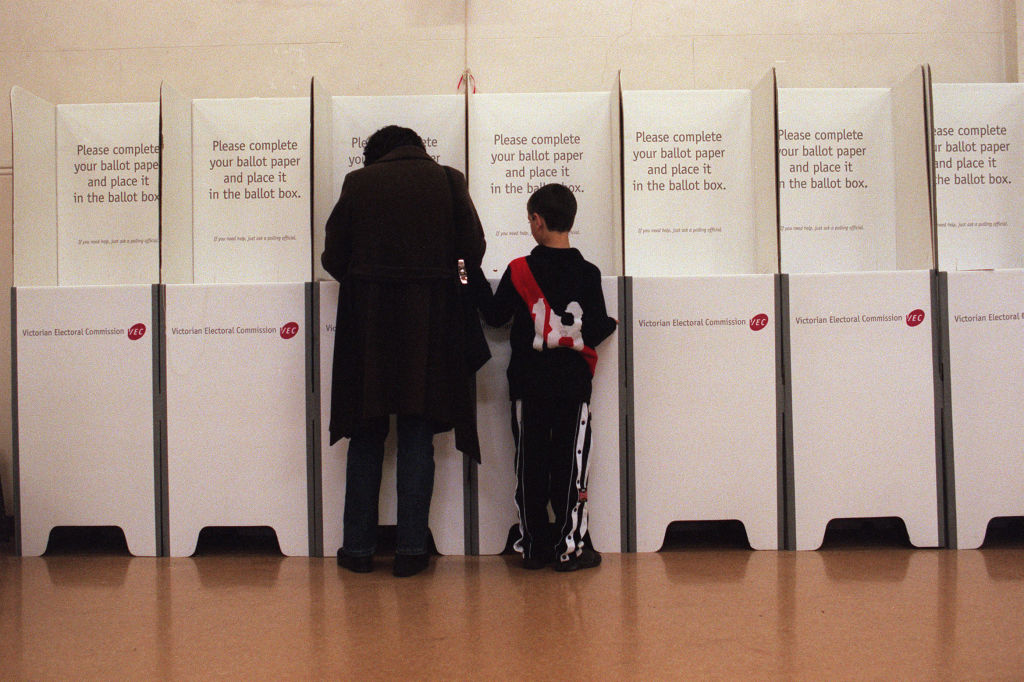
Attend any open home or auction in Canberra over the next few weeks and, no doubt, there will be conversations about holding off until after next month’s federal election.
But, data shows the perception of a market a slowdown in the lead-up to an election campaign is not always the case.
Domain group data from the past 18 years – since the 2001 federal election – shows there is no distinct trend of declines in prices, listings or sold properties in the quarter leading up to, and of, an election.
“It’s hard to decipher a clear trend based solely on the elections because the property market dynamics are driven by so many different factors,” Domain senior research analyst Nicola Powell said.
| Quarter | Election date | Median house price | YoY growth | Sold | YoY change in sold properties | Auction volume | Clearance rate |
| December 2001 | November 10 2001 | $255,610 | 24.40% | 2028 | 19.10% | 238 | 55% |
| September 2004 | 9 October 2004 | $383,103 | 2.40% | 1064 | -35.80% | 110 | 44% |
| December 2007 | 24 November 2007 | $484,617 | 11.40% | 1621 | 4.60% | 390 | 66% |
| September 2010 | 21 August 2010 | $561,964 | 10.70% | 1286 | -20.60% | 260 | 55% |
| September 2013 | 7 September 2013 | $565,666 | 1.10% | 1304 | 10.50% | 292 | 54% |
| June 2016 | 2 July 2016 | $664,240 | 6.40% | 1443 | -1.20% | 695 | 64% |
Dr Powell said it’s the policies that are implemented afterwards that will affect the market more.
“Looking at the election impacting the market is too much of a simplistic view, it’s about the policies implemented afterwards that will have a greater impact,” she said.
Despite data not showing any downward trend in the lead-up to an election, vendors do express reservations about listings around an election.
“You will likely see a bit of seller hesitation in the lead-up to an election or sellers strategically listing their home so an auction doesn’t fall on an election day,” Dr Powell said.
- Related: The median house prices of ACT’s electorates
- Related: How did Canberra’s fastest growing suburbs perform in the property market last year?
- Related: Canberra’s auction performance at lowest point since 2013
LJ Hooker franchise owner Matthew Herbert said there is a general sentiment of uncertainty among vendors that does feed into the perception.
“There is a bit of uncertainty, especially for people thinking of selling their house,” he said.
“The anecdotal evidence is there are fewer listings coming onto the market in the weeks leading up to the election, [with people] waiting to see if there is a change in government and if there are new policies that will affect the employment in Canberra.”
Auction volumes and clearance rates on the day of an election vary as well.
| Date | Auction volume | Clearance rate |
| 3 November 2001 | 12 | 69% |
| 10 November 2001 | 12 | 50% |
| 17 November 2001 | 20 | 57% |
| 2 October 2004 | 5 | n/a |
| 10 October 2004 | 8 | n/a |
| 17 October 2004 | 12 | 36% |
| 17 November 2007 | 46 | 81% |
| 24 November 2007 | 32 | 57% |
| 1 December 2007 | 27 | 52% |
| 14 August 2010 | 16 | 73% |
| 21 August 2010 | 17 | 44% |
| 28 August 2010 | 22 | 47% |
| 31 August 2013 | 18 | 65% |
| 7 September 2013 | 33 | 63% |
| 14 September 2013 | 14 | 69% |
| 25 June 2016 | 44 | 69% |
| 2 July 2016 | 21 | 40% |
| 9 July 2016 | 42 | 80% |
*Dates in bold represent election dates
The highest clearance rate for an election Saturday was in September 2013: 62.5 per cent of properties sold under the hammer. There were 16 auctions on the day, down from 24 the week before.
But in 2016, the volume of auctions was half on election day compared with the week before and after. The clearance rate also dropped week-on-week by 30 per cent, and the Saturday after the election recorded an 80 per cent rate.
Herbert said “seasonal factor[s] come into play with the timing of an election”, and, this year, any pre-election slowdown may feel more evident with winter coming, combined with softening prices nationally.
“This year, we are heading into winter after the election, [people] don’t want to list in winter because the house won’t look as good,” he said.
“Markets generally around Australia are softish at the moment, and it’s unrealistic to expect Canberra can avoid what is happening nationally – with Canberra heading into an election the perception is greater.”
We recommend
We thought you might like
States
Capital Cities
Capital Cities - Rentals
Popular Areas
Allhomes
More


