Geography, incomes and perceived prestige: Australia's cities ranked by housing market inequality
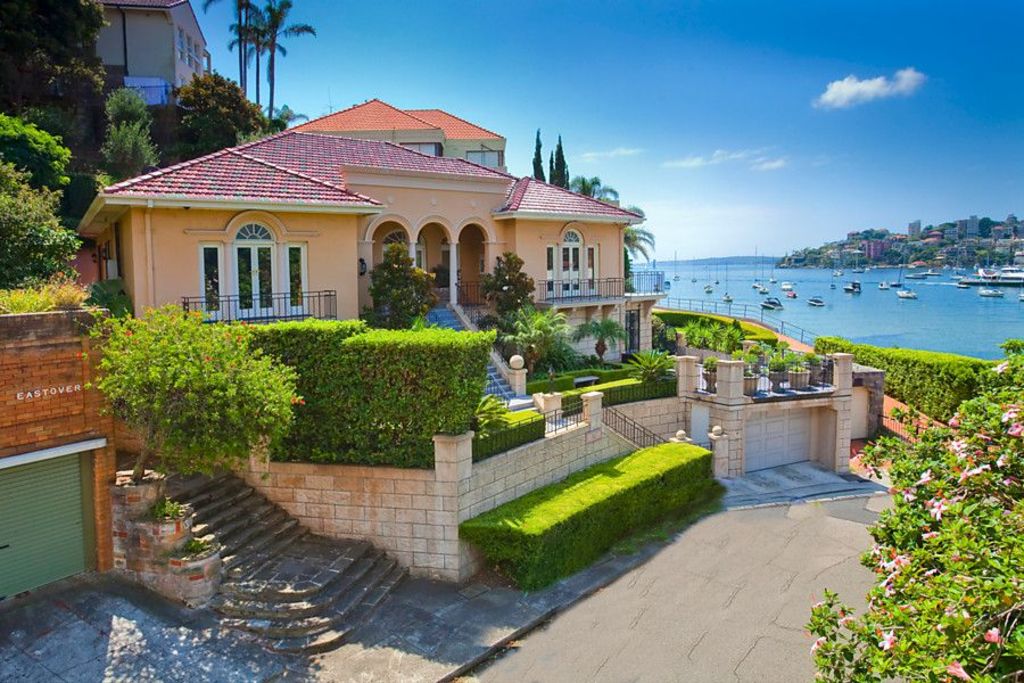
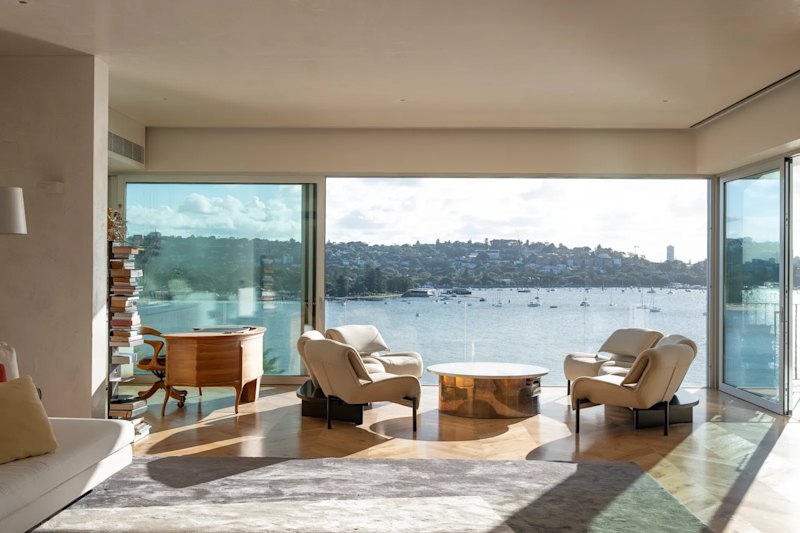
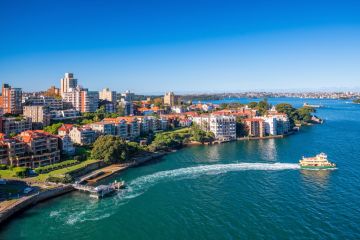
Sydney’s sparkling harbour and stunning beaches make it one of the world’s most desirable cities in which to live. But the huge price gap between a house with harbour views or near a beach and a typical house in a Sydney suburb contributes to Sydney’s property market being Australia’s most unequal.
The same applies to apartments in the harbour city, with a much wider gap between top-end apartments and cheap options than in other capital cities. Melbourne has the second-most unequal property market. Somewhat surprisingly, Hobart also has an unequal unit market.
In contrast to the vast property price gap in Sydney, Canberra is Australia’s most egalitarian housing market, with the difference between expensive and cheaper homes much smaller than all other capitals.
The equality of Australia’s capital city property markets, and why some markets are more unequal than others, can be explained by geography, incomes and perceived prestige.
Sydney’s position as Australia’s most unequal capital city housing market is shown in the table below by the price percentile ratios being much higher than all other capital cities (the table shows the ratio of house and unit prices at different price ‘percentiles’ in 2018). For example, a house in Sydney at the 90th price percentile costs almost four times what a house at the 10th percentile costs (the ’90th/10th’ ratio).
The graphs below show that Sydney has been the most unequal capital city for houses over the past 15 years, except for a brief period in 2003-04 when cheaper Sydney homes saw rapid price growth, and in 2015 when strong price growth at the top-end of the Melbourne market saw Melbourne equal Sydney briefly as the most unequal property market.
| Sydney is Australia’s most unequal capital city housing market
Ratio of property price percentiles for Australian capital cities, 2018 | ||||||||
|---|---|---|---|---|---|---|---|---|
| Sydney | Melbourne | Brisbane | Perth | Adelaide | Canberra | Hobart | Darwin | |
| Houses | ||||||||
| 95th/10th | 5.2 | 4.2 | 3.6 | 4.3 | 4.0 | 3.0 | 3.7 | 3.4 |
| 95th/50th | 3.2 | 2.8 | 2.3 | 2.6 | 2.4 | 2.1 | 2.1 | 2.0 |
| 90th/10th | 3.9 | 3.2 | 2.8 | 3.3 | 3.0 | 2.4 | 3.1 | 2.7 |
| 90th/50th | 2.4 | 2.2 | 1.8 | 2.0 | 1.8 | 1.6 | 1.8 | 1.6 |
| 75th/25th | 2.1 | 1.8 | 1.7 | 1.8 | 1.8 | 1.5 | 1.8 | 1.6 |
| Units | ||||||||
| 95th/10th | 3.8 | 3.4 | 3.1 | 3.8 | 3.0 | 2.8 | 4.0 | – |
| 95th/50th | 2.5 | 2.1 | 2.1 | 2.3 | 1.9 | 1.9 | 2.3 | – |
| 90th/10th | 3.0 | 2.6 | 2.5 | 3.1 | 2.4 | 2.3 | 3.4 | – |
| 90th/50th | 1.9 | 1.7 | 1.7 | 1.8 | 1.6 | 1.6 | 1.9 | – |
| 75th/25th | 1.6 | 1.6 | 1.6 | 1.7 | 1.6 | 1.5 | 1.7 | – |
|
Note: Darker blue indicates a more unequal property market in each row, lighter green indicates a more equal property market in each row. A price percentile refers to a point on the ranking of properties from cheapest to most expensive over a certain period. For example, the 90th price percentile refers to the price of a sold property where 90 per cent of sales were at a lower price. A higher ratio indicates that a market is more unequal, i.e. that more expensive houses/units cost a lot more than a typical or a cheap house/unit. Figures for Hobart and Darwin should be interpreted with caution due to small sample sizes. Darwin units excluded due to small sample size. Source: Domain Group | ||||||||
Sydney is also one of Australia’s most unequal property markets for units. Sydney had the highest 95th/50th ratio and second highest 95th/10th ratio for units in 2018. ‘Cheap’ Sydney units are much more expensive than cheap options in other cities. In December 2018, a Sydney unit at the 10th price percentile sold for $460,000, compared to $325,000 in Melbourne and below $300,000 in other capital cities. Top-end apartments are also much more expensive in Sydney.
So why is Sydney Australia’s most unequal property market? Sydney’s unique geography is a major factor. Proximity to beaches and the harbour makes Sydney’s top-end property astronomically expensive as people are willing to pay a large premium to live near the coast and the harbour. Homes close to the CBD, where a growing share of high-paying jobs is located, also command a premium. Another factor is Sydney’s status as a ‘superstar city’, with Sydney accounting for one-quarter of Australia’s GDP. But although average incomes are higher in Sydney than in other parts of Australia, Sydney also has the most unequal incomes of all Australia’s capital cities, resulting in a wide gap between what type of home people can afford.
| Sydney is Australia’s most unequal capital city housing market
Property values at different price percentiles for Australian capital cities, 2018 | ||||||||
|---|---|---|---|---|---|---|---|---|
| Sydney | Melbourne | Brisbane | Perth | Adelaide | Canberra | Hobart | Darwin | |
| Houses | ||||||||
| 10th | $559,000 | $491,000 | $349,000 | $300,000 | $290,000 | $470,000 | $265,000 | $305,000 |
| 25th | $682,000 | $580,000 | $422,000 | $380,750 | $370,000 | $575,000 | $346,000 | $415,000 |
| 50th | $930,000 | $727,000 | $550,000 | $495,000 | $487,000 | $695,000 | $455,000 | $505,000 |
| 75th | $1,425,000 | $1,032,000 | $725,000 | $689,259 | $655,000 | $864,000 | $600,000 | $615,000 |
| 90th | $2,180,000 | $1,512,000 | $952,500 | $954,437 | $910,000 | $1,150,000 | $782,000 | $740,000 |
| 95th | $2,900,000 | $1,980,000 | $1,250,000 | $1,250,000 | $1,180,000 | $1,400,000 | $930,000 | $950,000 |
| Units | ||||||||
| 10th | $460,000 | $324,900 | $273,000 | $205,000 | $220,000 | $300,000 | $205,000 | – |
| 25th | $580,000 | $400,000 | $330,000 | $262,000 | $275,000 | $366,500 | $278,000 | – |
| 50th | $730,000 | $520,000 | $402,500 | $359,000 | $340,000 | $430,000 | $360,000 | – |
| 75th | $970,000 | $655,000 | $525,000 | $481,000 | $425,000 | $541,000 | $459,875 | – |
| 90th | $1,395,000 | $850,000 | $685,000 | $680,000 | $538,000 | $678,000 | $710,000 | – |
| 95th | $1,800,000 | $1,057,000 | $850,000 | $825,000 | $655,000 | $835,000 | $800,000 | – |
|
Notes: the 50th price percentile is the raw median, not the stratified median that is used in Domain’s House Price Reports. Figures for Hobart and Darwin should be interpreted with caution due to small sample sizes. Darwin units excluded due to small sample size. Source: Domain Group | ||||||||
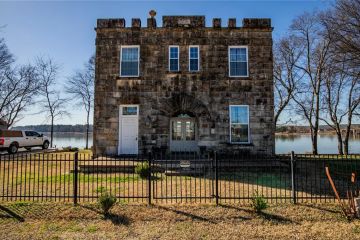
On the flip side, Canberra is currently Australia’s most equal capital city property market. But Canberra’s property market isn’t relatively equal because the top end is affordable, it’s because the cheaper houses and units are actually pretty pricey. A cheap Canberra house at the 10th price percentile sold for $470,000 in December 2018, which was much more expensive than a house at the same price percentile in Brisbane, Perth and Adelaide. Canberra and Darwin have vied for the title of the most equal house market since 2004.
Three main factors are the likely reasons Canberra’s property market is Australia’s most equal. First, Canberra is the only capital city not situated on a natural river, harbour or ocean, so there are no properties near a beach or with an ocean view that are highly desirable for which people are willing to pay a premium. Second, Canberra is Australia’s most spread out city with jobs scattered around the city that are (mostly) easily accessible by car. In contrast, Sydney and Melbourne are more monocentric cities, with greater congestion, which makes proximity to the city very valuable. And finally, the ACT has the second most equal income distribution of all Australia’s capital cities (Darwin is the most equal), with the high proportion of public sector jobs in the ACT contributing to this relative income equality.
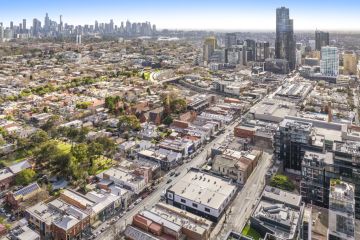
Melbourne’s property market has been the second or third most unequal of all the capital cities for the past 15 years. Melbourne surpassed Sydney for houses on some price ratio measures briefly in late 2015. But due to strong price growth at the lower end of the Melbourne market in 2017 and more expensive homes falling in price over 2018, Melbourne’s housing market became more equal over the past two years to sit on par with or just above most other capitals.
A major reason why Melbourne’s property market is more equal than Sydney’s is that there are not the same spectacular locations as in Sydney. While the prestige suburbs of Toorak and Brighton are very nice places to live, they are not as naturally beautiful as Vaucluse, Bronte and Mosman. And the Yarra River is no Sydney Harbour. Melbourne is more unequal than other smaller capitals as proximity to the city is more valuable in a large city, particularly as jobs growth has been faster in the CBDs of Melbourne and Sydney than in the suburbs and congestion has worsened. Melbourne also has the third-highest income inequality of all capital cities, which means some people can afford to pay more for expensive properties in more desirable locations.
Hobart has consistently been the most or second-most unequal unit market since 2010, and it has become more unequal over the past few years. Hobart’s inequality is due to the cheapest Hobart units being very cheap – a unit at the 10th percentile in Hobart is cheaper than in most other capital cities. There are also relatively expensive Hobart units that might have River Derwent views or are near a beach. At odds with the unit market, Hobart’s house market is quite egalitarian.
Perth’s housing market has generally been around the middle of the pack but has become a bit more unequal in recent years due to prices for cheaper houses falling by more than they have for expensive houses. Perth’s unit market is one of the most unequal unit markets and has become more unequal over the past few of years as unit prices have fallen by more at the lower price points.
And Brisbane and Adelaide? They’ve consistently been middle of the pack since 2004 for houses, but Adelaide’s unit market is almost as equal as Canberra’s unit market on most measures.
Many of the factors that influence the equality of a city’s housing market, such as geography, size, congestion, job dispersion and income inequality, have combined to make Sydney’s property market much more unequal than other Australian capital cities.
Some inequality in property prices is not surprising, particularly in Australia’s coastal cities where some properties command a large premium due to their location. But it’s well-documented that property market inequality contributes to wealth inequality and may also be a sign of a divided city, with some citizens missing out on the opportunities cities can provide. Given that, governments and policymakers should not ignore housing market inequality as part of any future efforts to address income and wealth inequality.


We thought you might like
States
Capital Cities
Capital Cities - Rentals
Popular Areas
Allhomes
More
