Regional house prices continue to grow, despite coronavirus pandemic, new figures show
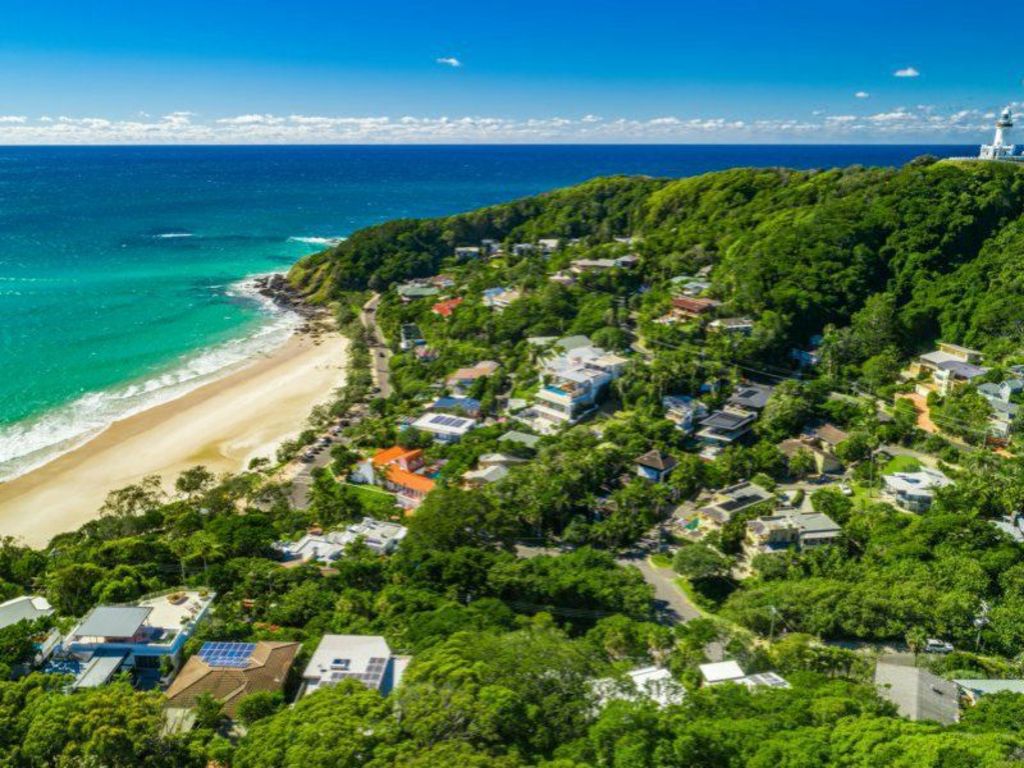
Property prices across much of regional Australia are rising despite the coronavirus-induced recession that has pushed most capital city markets into a downturn.
Strong price growth in mining towns and tree-change destinations was revealed in the latest Domain House Price Report.
Median dwelling values — combining both houses and units — for regional Australia edged up 0.1 per cent over the three months to June to a median of $417,608.
| Source: Domain House Price Report, June quarter. | |||
| Dwelling values – House and units combined | |||
| City | Median price | QoQ Change | YoY Change |
| Sydney | $974,853 | -2.00% | 9.40% |
| Melbourne | $773,519 | -3.10% | 6.80% |
| Brisbane | $527,764 | -1.90% | 0.20% |
| Adelaide | $505,125 | -0.20% | 2.30% |
| Canberra | $688,028 | 2.80% | 6.40% |
| Perth | $484,671 | -2.00% | -1.20% |
| Hobart | $509,320 | 0.90% | 11.10% |
| Darwin | $377,541 | -1.90% | -7.90% |
| National – Capitals | $734,334 | -2.10% | 6.00% |
By comparison the median dwelling value for all the capital cities combined fell 2.1 per cent over the three months to a median of $734,334.
“Regional areas typically do not provide the big swings of cities, and do provide homeowners with steady capital growth,” Domain senior research analyst Nicola Powell said.
The largest gains were in regional Tasmania, Victoria and NSW, where prices rose 3.4 per cent, 1.6 per cent and 1 per cent respectively.
By comparison, prices in Hobart grew just 0.9 per cent, while values in Melbourne fell 3.1 per cent and Sydney lost 2 per cent.
| Source: Domain House Price Report, June quarter. *Not enough sales for a reliable median. | |||
| Dwelling values – Houses and units combined | |||
| Regions | Median price | QoQ Change | YoY Change |
| Rest of NSW | $503,972 | 1.00% | 6.20% |
| Rest of VIC | $403,789 | 1.60% | 6.90% |
| Rest of QLD | $377,054 | -1.50% | -0.60% |
| Rest of SA | $317,651 | 0.60% | 3.70% |
| Rest of WA | $349,343 | -2.50% | 1.80% |
| Rest of TAS | $337,323 | 3.40% | 11.70% |
| Rest of NT | snr* | snr* | snr* |
| National – Regional | $417,608 | 0.10% | 3.80% |
Such regional markets were less reliant on overseas and interstate migration, which had been brought to a standstill by coronavirus, Dr Powell said.
The largest falls were concentrated in Sydney and Melbourne, hotspots for new arrivals to Australia, while Hobart’s market had previously been bolstered by interstate migration, she said.
The affordability of regional markets — particularly in Victoria and NSW — had also contributed to greater gains, she said, as priced-out buyers relocated to cheaper satellite cities.
| Top house price rises – Victoria | ||
| Source: Domain House Price Report, June quarter. | ||
| LGA | Median Price | YoY Change |
| Colac Otway | $432,500 | 19.3% |
| Golden Plains | $585,000 | 15.8% |
| Mansfield | $470,000 | 13.3% |
| Central Goldfields | $274,000 | 10.9% |
| Baw Baw | $485,000 | 10.2% |
“Sydney and Melbourne’s prices have had bigger gains in the past and so have also had bigger losses, whereas regional areas have had strong growth but haven’t surpassed city counterparts. When they have fallen they’ve typically been soft falls,” Dr Powell said.
“Affordability has also become an issue for Hobart residents and I think that push to other areas has certainly occurred as a result.”
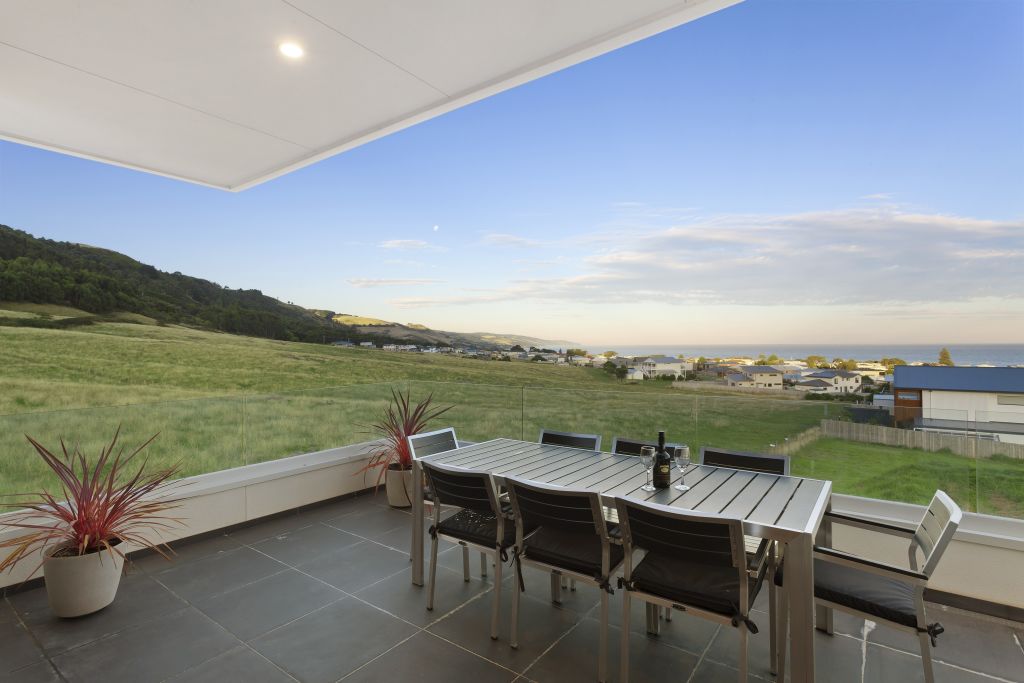
In Tasmania, it was the Huon Valley, about 40 kilometres south-west of Hobart, which had the greatest quarterly gain of any council area in the state – with the median up 21.9 per cent over the six months to June.
In Victoria, the coastal shire of Colac Otway and the Golden Plains council area — between Geelong, Ballarat and Melbourne — saw the strongest price growth, at 19.3 per cent and 15.8 per cent, respectively.
Dr Powell said agricultural areas offering employment opportunities and tree and sea-change destinations were holding up well – with agents reporting more people are looking to leave the big cities behind.
“I think the pandemic has made us all evaluate where we are, the lifestyles that we live and what we’re offering in terms of bringing up our children,” she said. “It’s forced many of us to work remotely forced, business to be more open-minded to a remote workforce and I think that could lead to a change in buying behaviour from homeowners.”
| Source: Domain House Price Report, June quarter. | ||
| Top house price rises – NSW | ||
| LGA | Median Price | YoY Change |
| Leeton | $320,000 | 23.1% |
| Byron | $1,050,000 | 21.0% |
| Parkes | $340,000 | 18.3% |
| Bellingen | $585,000 | 15.3% |
| Murray River | $460,000 | 15.0% |
In NSW, the council area of Leeton in the Riverina saw the largest rise, with the median jumping 23.1 per cent, followed by Byron on the north coast with a gain of 21 per cent.
Selling agent Luke Santolin, of Leeton Real Estate, said he had been having a record run, despite the pandemic, with a shortage of homes for sale pushing up prices in the area.
“The last 60 days have been a record for us,” he said.
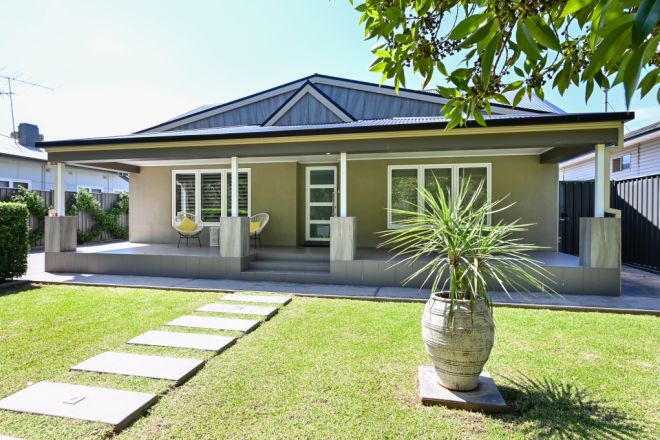
Mr Santolin said Leeton had long made lists of the most affordable regions in the state, and as a result, had seen an increase in people retiring to the area. Younger buyers looking for better value for money were also looking to the area, with the larger hub of Griffith about a 50-minute drive away.
Homes have been selling quicker, and for higher prices, Mr Santolin said, but added there had also been an increase in the number of more expensive homes sold, which could be skewing the median.
| Source: Domain House Price Report, June quarter. | ||
| Top house price rises – Tasmania | ||
| LGA | Median Price | YoY Change |
| Huon Valley | $445,000 | 21.9% |
| Break O’Day | $343,000 | 20.4% |
| Derwent Valley | $325,500 | 20.3% |
| Brighton | $379,250 | 20.0% |
| Meander Valley | $385,000 | 18.5% |
Queensland and Western Australia were the only states where prices fell outside of the capital cities, with drops of 1.5 and 2.5 per cent.
While regional Queensland prices still held up better than those in Brisbane, prices in regional WA overall fared worse than those in Perth over the quarter, although some mining towns were standouts.
| Top house price rises – Queensland | ||
| Source: Domain House Price Report, June quarter. LGA medians based on sales over six months to June. | ||
| LGA | Median Price | YoY Change |
| Isaac | $275,000 | 32.5% |
| Burdekin | $285,000 | 27.5% |
| Cassowary Coast | $290,000 | 16.0% |
| Mount Isa | $265,750 | 15.5% |
| Central Highlands | $300,000 | 11.9% |
In addition to tree-change destinations, mining towns continued to see strong price growth due to the recovering resources industry, with house prices in the Queensland council area of Isaac — which includes coal mining town Moranbah — seeing the greatest price increase of any local government area in the country, jumping 32.5 per cent over the six months to June.
House prices in Karratha, an iron ore town in WA, were also up 22.9 per cent. As were prices in Parkes, NSW, and Mount Isa, Queensland, jumping 18.3 and 15.5 per cent.
“There is a recovery in the resource sector so I would expect some of those resource towns to be performing much better than they once were,” Dr Powell said.
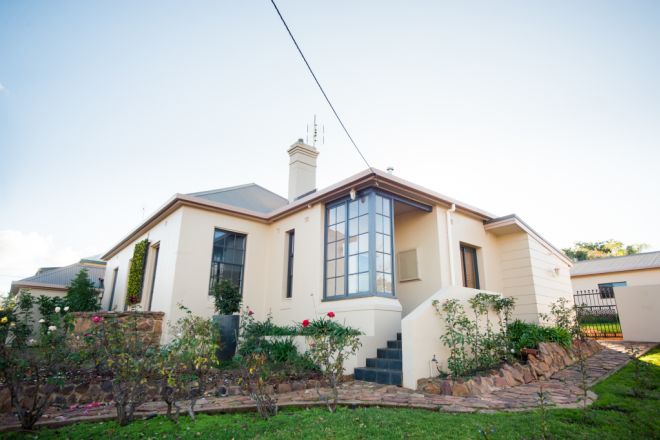
Tara Smyth, of LJ Hooker Mackay Group, said a pick-up in the resources sector in Isaac and drop in deposit requirements — previously as high as 30 per cent for homes in the area — had seen prices soar.
“There’s definitely been a strengthening workforce, there are a lot more vacancies than before … people moving back to that area, and there [has been a reduction in the amount of] fly in and fly out work,” she said. “The lower deposit requirement has also created more demand.”
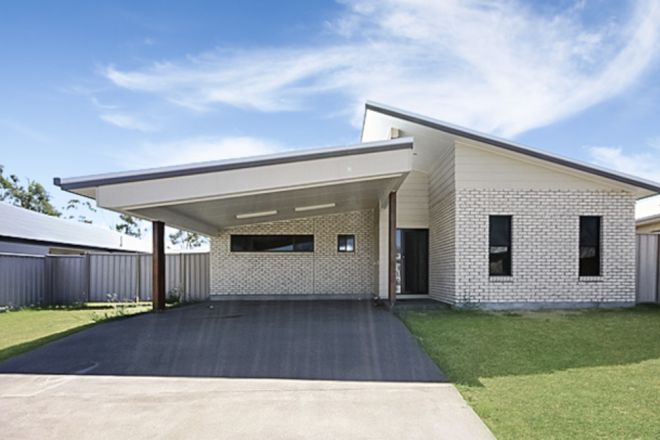
While April had been a dismal month for sales, Ms Smyth said, the market had been back on track since.
“I believe we’re in a bit of a bubble up here,” she said. “July is heating up to be quite a significant sales month.”
We recommend
We thought you might like
States
Capital Cities
Capital Cities - Rentals
Popular Areas
Allhomes
More
