Rental vacancy rates back at pre-pandemic levels: Domain data
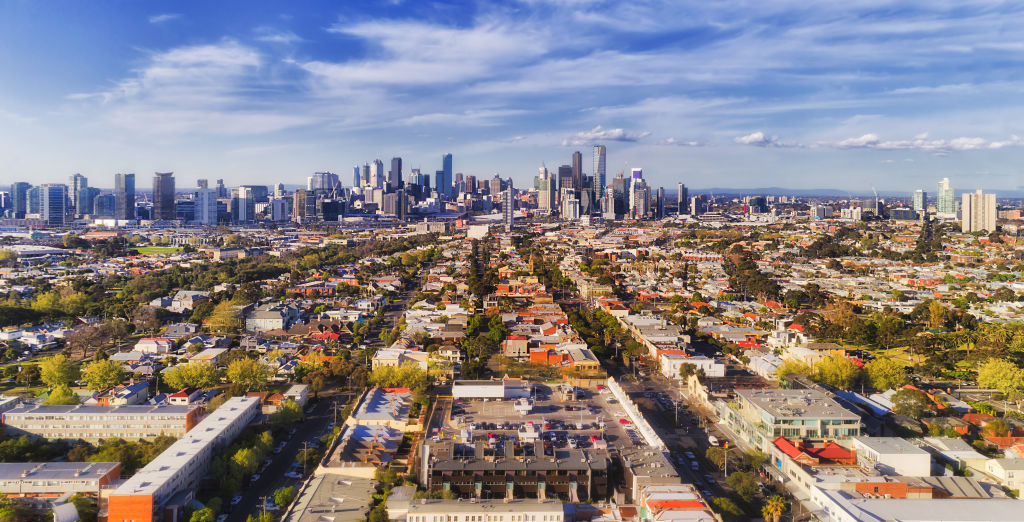
Australia’s rental vacancy rate is back at pre-pandemic levels, new data shows, but up to one in 10 rental homes are still sitting empty in some pockets.
Vacancy rates dropped in both Sydney and Melbourne over April to 2.9 per cent and 4.2 per cent, respectively, as more tenants returned to the inner-city markets where rental demand and asking prices were hard hit by the coronavirus pandemic.
The proportion of homes left vacant held steady at 1.4 per cent in Brisbane, Domain data shows, with fewer than one in 100 rental homes left vacant across the other capital cities – where rates either held steady or lifted marginally month on month.
Nationally, the vacancy rate fell to 1.8 per cent, its lowest level since March 2020, with more than 57,000 rentals estimated to be sitting empty at the end of the month. That’s down more than 25 per cent since last April when the country was mid-lockdown.
Capital City Rental Vacancy RatesApril 2021 |
|||||
| Apr-21 | Mar-21 | Apr-20 | Monthly Change | Annual Change | |
| National | 1.8% | 1.9% | 2.6% | ↓ | ↓ |
| Sydney | 2.9% | 3.0% | 4.0% | ↓ | ↓ |
| Melbourne | 4.2% | 4.6% | 2.8% | ↓ | ↑ |
| Brisbane | 1.4% | 1.4% | 2.9% | – | ↓ |
| Perth | 0.8% | 0.7% | 2.4% | ↑ | ↓ |
| Adelaide | 0.6% | 0.6% | 1.2% | – | ↓ |
| Hobart | 0.5% | 0.4% | 1.4% | ↑ | ↓ |
| Canberra | 0.8% | 0.7% | 1.4% | ↑ | ↓ |
| Darwin | 0.6% | 0.6% | 3.5% | – | ↓ |
| Source: Domain The vacancy rate represents the portion of available, empty rental properties relative to the total stock of rental property. The rental vacancy rate is based on adjusted Domain rental listings and will be subject to slight revisions over time. |
|||||
Domain senior research analyst Nicola Powell said the decline had been largely driven by Melbourne, where there were just over 24,000 estimated vacant rental listings at the end of April, down 7 per cent from March.
The citywide vacancy rate was still elevated though, Dr Powell said, noting Melbourne was the only capital city where the rate was still up year-on-year, which she attributed to the jump in vacancies seen during the city’s two lockdowns and the market’s greater reliance on overseas immigrants and international students.
“I think Melbourne will have an elevated vacancy rate until we see international borders reopen,” she said.
Highest vacancy rates across capital city areasApril 2021 |
|||||
|
Rank
|
Sydney | Melbourne | Brisbane & Gold Coast | Perth | Adelaide |
| 1 | Auburn (4.8%) | Melbourne City (10.2%) | Brisbane Inner (3.8%) | Perth City (1.6%) | Adelaide City (4.6%) |
| 2 | Parramatta (4.8%) | Stonnington – East (7.8%) | Sherwood – Indooroopilly (2.8%) | Cottesloe – Claremont (1.5%) | Holdfast Bay (1%) |
| 3 | Strathfield – Burwood – Ashfield (4%) | Whitehorse – West (6.9%) | Brisbane Inner – West (2.7%) | South Perth (1.1%) | Norwood – Payneham – St Peters (0.9%) |
| 4 | Canterbury (3.8%) | Stonnington – West (6.7%) | Nathan (2.3%) | Melville (1%) | Prospect – Walkerville (0.8%) |
| 5 | Botany (3.5%) | Boroondara (6%) | Mt Gravatt (2%) | Belmont – Victoria Park (0.9%) | Unley (0.7%) |
| Source: Domain The vacancy rate represents the portion of available, empty rental properties relative to the total stock of rental property. The rental vacancy rate is based on adjusted Domain rental listings and will be subject to slight revisions over time. Areas are based on ABS SA3 geography that are located in a capital city GCCSA. |
|||||
The largest drop in vacant properties was in the inner city, where the rate dropped to 10.2 per cent in April — down from a peak of 14.6 per cent in October — in a sign that tenants may be returning to inner-city apartment living, Dr Powell said.
“We’re definitely seeing an improvement; we’ve got a lot of people coming through inspections,” said Daniella Ferraro, a senior property manager at Harcourts Melbourne City.
Local renters were looking to upsize to take advantage of rent reductions – with the median unit rent in inner Melbourne down 22 per cent annually — while some tenants in the suburbs were looking to relocate closer to the city centre or move out of share housing while prices were lower, Ms Ferraro said.
There was also more interest from renters relocating from interstate and some home sellers transitioning back to the rental market before their next purchase; however, demand from students was still lacking.
While the number of vacant rentals was falling, Ms Ferraro expected it could be two years before rents in the area started to climb again, with rents for some properties having fallen by almost 50 per cent over the past year.
Lowest vacancy rates across capital city areasApril 2021 |
|||||
|
Rank
|
Sydney | Melbourne | Brisbane & Gold Coast | Perth | Adelaide |
| 1 | Camden (0.3%) | Mornington Peninsula (0.4%) | Capalaba (0.2%) | Wanneroo (0.3%) | Tea Tree Gully (0.2%) |
| 2 | Wyong (0.4%) | Yarra Ranges (0.5%) | Caboolture Hinterland (0.2%) | Kwinana (0.4%) | Marion (0.2%) |
| 3 | Gosford (0.5%) | Nillumbik – Kinglake (0.5%) | Nerang (0.3%) | Stirling (0.4%) | Port Adelaide – East (0.2%) |
| 4 | Blue Mountains (0.5%) | Cardinia (0.5%) | Gold Coast Hinterland (0.3%) | Rockingham (0.5%) | Playford (0.2%) |
| 5 | Sutherland – Menai – Heathcote (0.7%) | Macedon Ranges (0.7%) | Coolangatta (0.4%) | Kalamunda (0.5%) | Gawler – Two Wells (0.3%) |
| Source: Domain The vacancy rate represents the portion of available, empty rental properties relative to the total stock of rental property. The rental vacancy rate is based on adjusted Domain rental listings and will be subject to slight revisions over time. Areas are based on ABS SA3 geography that are located in a capital city GCCSA. |
|||||
Vacancy rates also fell in inner Sydney and Brisbane, hitting 3.1 per cent and 3.8 per cent, respectively.
“We are seeing people come back to the city, but they’re coming back slowly,” said Michael Lowdon of Ray White Residential Sydney CBD.
The top end of the rental market was particularly strong, with solid demand for larger apartments and growing interest from downsizers who had opted to sell in the strong market but had yet to purchase their next home, he said.
“The middle [of the market] is okay, and at the lower end of the market, the enquiry rates are a lot higher now, but you still need to be super competitive when you come to put a price against your apartment. If it’s not competitive, you’re not going to find a tenant,” he said.
Despite the uptick in interest, Mr Lowdon warns landlords to expect at least another 12 to 24 months of softer market conditions due to an influx of new apartments poised to hit the inner city rental market. He added a rebound would be reliant on borders reopening and the return of more inner-city workers.
Areas with the biggest drop in estimated number of vacant rentals |
||
| Rank | City | Area |
| 1 | Melbourne | Melbourne City |
| 2 | Melbourne | Stonnington – West |
| 3 | Melbourne | Glen Eira |
| 4 | Sydney | Sydney Inner City |
| 5 | Sydney | North Sydney – Mosman |
| 6 | Melbourne | Monash |
| 7 | Melbourne | Brunswick – Coburg |
| 8 | Sydney | Chatswood – Lane Cove |
| 9 | Sydney | Kogarah – Rockdale |
| 10 | Sydney | Strathfield – Burwood – Ashfield |
| 11 | Sydney | Merrylands – Guildford |
| 12 | Melbourne | Essendon |
| 13 | Melbourne | Maribyrnong |
| 14 | Melbourne | Boroondara |
| 15 | Sydney | Eastern Suburbs – South |
| 16 | Sydney | Pennant Hills – Epping |
| 17 | Melbourne | Darebin – North |
| 18 | Sydney | Ku-ring-gai |
| 19 | Melbourne | Port Phillip |
| 20 | Melbourne | Banyule |
| Areas are based on ABS SA3 geography that are located in a capital city GCCSA. These are the areas with the biggest drop in estimated number of vacant rentals. | ||
Outside of the big cities, vacancy rates remain very low, with areas such as Orange in NSW, Shepparton in Victoria and the Whitsundays in Queensland among 25 regional areas that recorded a vacancy rate of 0.2 per cent or less.
Smaller regional markets were traditionally tighter, Dr Powell said but had seen vacancy rates fall further over the past year as more Australians looked to make a sea or tree change due to the rise of remote working during the pandemic.
While some tree and sea-changers could potentially return to capital cities in the coming months, vacancy rates would likely remain tight in many regional markets, Dr Powell said.
We recommend
We thought you might like
States
Capital Cities
Capital Cities - Rentals
Popular Areas
Allhomes
More
