Sellers return to market as restrictions ease, new listings data shows
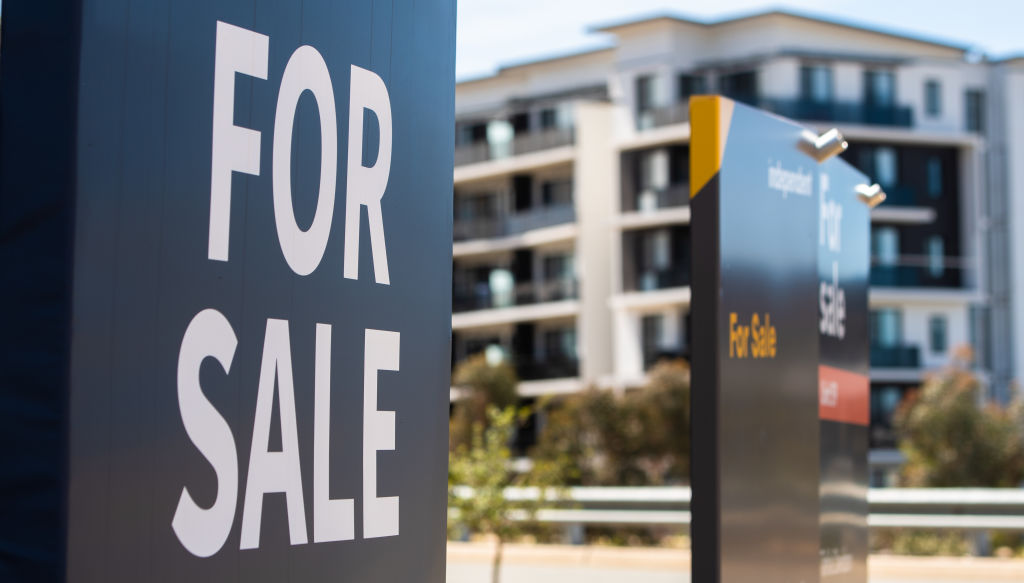
The number of homes hitting the property market is on the rise, with new data showing an increase in listings as social distancing restrictions have been eased.
Selling activity has been ramping back up across Australia, after bans on public auctions and open homes – implemented in March to curb the spread of COVID-19 – were lifted last month.
Sydney’s property market saw the biggest jump, with Domain data showing a 32 per cent increase in new listings over the four weeks to May 24, compared to the previous four weeks.
Perth was next with a 30 per cent rise, followed by Melbourne and Brisbane which both saw a 15 per cent increase and Adelaide with a 6 per cent jump.
“New listings have rebounded for a number of weeks now from the low point in April,” said Domain economist Trent Wiltshire. “But they are still are well below where they were in February when the market was really strong.”
Mr Wiltshire said the increase reflected a rebound in seller confidence off the back of eased restrictions, and did not suggest any increase in forced sales, with recent data showing distressed sales only recorded a marginal increase.
| Source: Domain. Note: Percentage changes compare new Domain listings for the four weeks to May 24, to the previous four weeks and the same period last year. | ||
| Change in new sales listings | ||
| Region | Four-week change | YOY Change |
| Greater Sydney | 32% | -2% |
| Greater Melbourne | 15% | -15% |
| Greater Brisbane | 15% | -25% |
| Canberra | -12% | -36% |
| Greater Perth | 30% | -31% |
| Greater Adelaide | 6% | -32% |
| Greater Hobart | -9% | -40% |
| Australia | 16% | -21% |
While new Domain listings were up 16 per cent nationally, they were down in both Hobart and Canberra, by 9 and 12 per cent respectively.
Mr Wiltshire attributed the negative results to their strong positions leading up to the coronavirus pandemic, which may have resulted in a delayed pullback in selling activity.
Despite some strong rebounds, the number of new sales listings was still down year-on-year across all capitals, with the biggest drops again in Hobart and Canberra, down 40 per cent and 36 per cent. The smallest difference was in Sydney, down 2 per cent year on year.
“While it’s almost back to where it was this time last year … May 2019 was a very weak time [for new listings] with both buyers and sellers cautious with the federal election and everything that was going on [amid the ongoing market downturn],” Mr Wiltshire said.
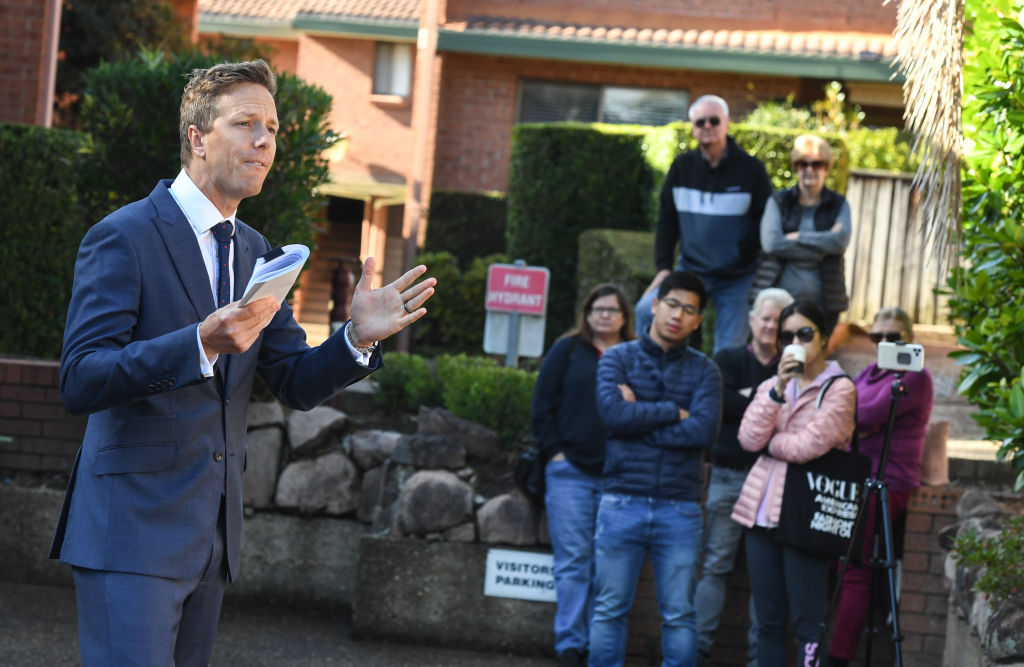
Sydney’s stronger rebound could be due to NSW being the first state to wind back industry restrictions, Mr Wiltshire said, resulting in an earlier return of market confidence.
This was reflected in the clearance rates, with the harbour city recording a rate of 59.1 per cent, compared to Melbourne’s 49.2 per cent, he said.
Sydney’s St George region saw the biggest rebound, with new Domain listings over the four-week period up 128 per cent on the previous four weeks. New listings improved across more than two-thirds of regions, with rebounds of more than 50 per cent recorded in Sydney’s northern and eastern suburbs, Victoria’s Mornington Peninsula, Cairns in Queensland and Western Australia’s south region.
John Kastellorios of Laing+Simmons St George said there had been a big boost in both buyer and seller confidence in recent weeks.
“At more properties we’ve got at least 20 groups coming through [the first open home] and if you looked at the month before, campaigns were only seeing seven or eight buyers coming through in the month,” he said.
| Source: Domain. Note: Percentage changes compare new listings for the four weeks to May 24, to the previous four weeks and the same period last year. | ||
| Top regions for increases in new sales listings | ||
| Region | Four-week change | YOY Change |
| NSW – St George | 128% | 57% |
| WA – South | 79% | -14% |
| NSW – Northern Suburbs | 68% | 41% |
| NSW – Eastern Suburbs | 63% | 14% |
| VIC – Mornington Peninsula | 55% | -11% |
| QLD – Cairns & District | 51% | -13% |
| QLD – West | 49% | -25% |
| VIC – West | 48% | 13% |
| QLD – Redlands City | 45% | -28% |
| WA – Mandurah & Surrounds | 43% | -40% |
St George was also one of just 10 regions out of 126 measured to see an annual increase in new listings, which were up 57 per cent year-on-year.
Mr Kastellorios said this was not surprising given sellers were returning at a typically quiet time of year, and added new developments could also be a factor in the region’s annual increase.
Mr Wiltshire added regional data was more prone to fluctuations and some regions would be rebounding from steeper declines. He said tourist areas could be more likely to see increases as holiday home owners decide to sell up due to the pandemic’s impact on the sector.
Figures released by SQM Research on Tuesday showed the total amount of property on the market across Australia increased by 3.9 per cent in May to 304,137, with a 12 per cent increase in the number of properties that had been on the market for more than 60 days.
“Overall, there was a rise in listings at the national level, driven by older stock not selling,” said managing director Louis Christopher. “This tells me it is a patchy market with vendors struggling to meet their pricing expectations.”
However, the total number of properties for sale was still down year-on-year.
Fresh property advertisements bottomed out at historic lows in May, according to CoreLogic data released this week, which also showed property values fell across five of the eight capital cities last month.
However the figures showed total stock levels still remained extremely low and continued to trend down, implying a healthy rate of absorption as buyers became more active.
CoreLogic’s head of research Tim Lawless said agent activity was also on the rise, with the number of reports generated by sales agents rising by around 45 per cent since the end of April, suggesting an increase in listings to come.
We recommend
We thought you might like
States
Capital Cities
Capital Cities - Rentals
Popular Areas
Allhomes
More
