The Sydney and Melbourne suburbs where the population is shrinking
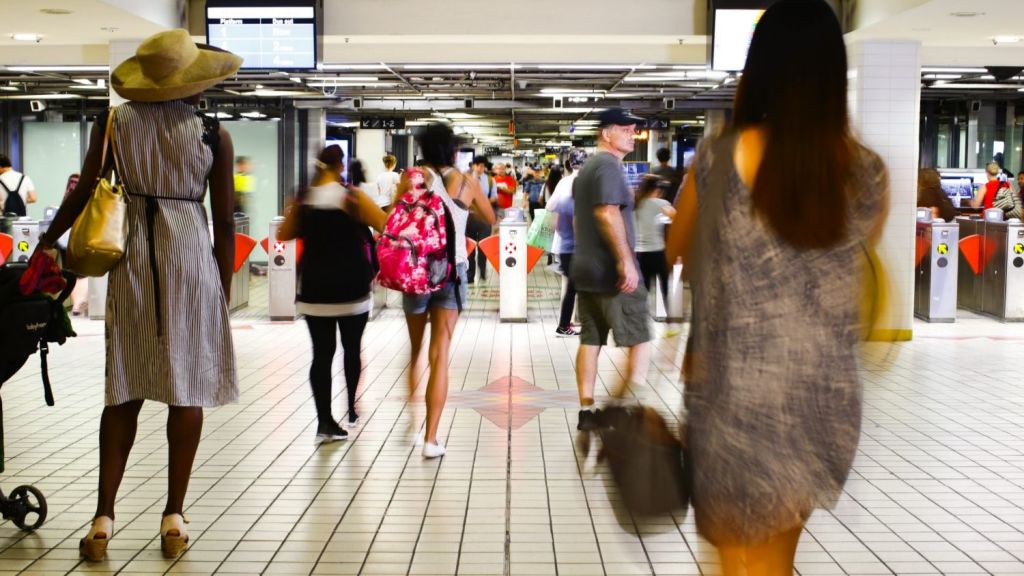
Australia’s booming population is making weekly headlines, but not everywhere is bursting at the seams.
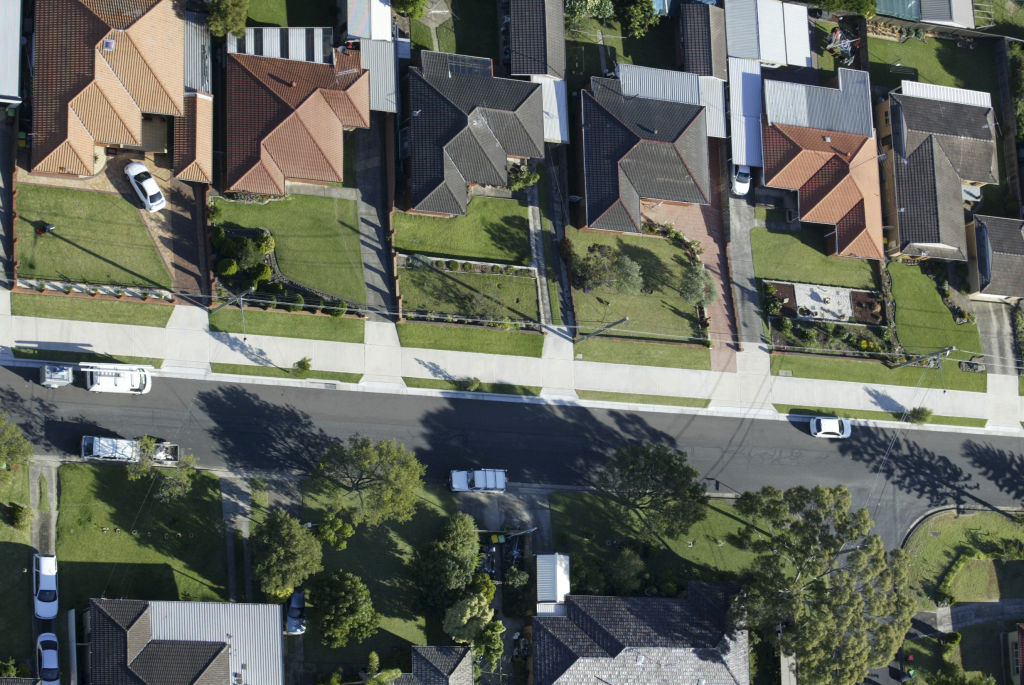
Take a closer look and you will find there are neighbourhoods in Melbourne and Sydney which have welcomed very few, if any, new residents in recent years, according to figures just released by the Australian Bureau of Statistics.
Between 2012 and 2017, the national population grew by 8.2 per cent, or 1.9 million people. Melbourne absorbed roughly one-third of that growth, while Sydney shouldered about a quarter, prompting concerns about liveability and housing shortages along the eastern seaboard.
But as dozens of inner-city and fringe suburbs struggle to keep up with the influx of new residents, others maintain a relatively stagnant population. And a handful of areas have actually shrunk.
Sydney
In the Campbelltown region, the Claymore-Eagle Vale area lost 640 residents over the five-year period, while the population in nearby Bradbury and Wedderburn fell by a much smaller total of 37.
In Sydney’s outer-west, the suburbs of Bligh Park and Windsor had 235 fewer residents in 2017 than they did in 2012.
Meanwhile, the number of people living in Cherrybrook dropped from 19,650 to 19,522, but it was a very different story in nearby Kellyville, where an additional 5500 people moved in, pushing the population to 25,360.
Sydney suburbs with stagnant populations
| Suburb | Est population 2012 | Est population 2017 | Change |
| Avalon/Palm Beach | 12,995 | 13,003 | 8 or 0.06% |
| St Johns Park/Wakeley | 11,146 | 11,214 | 68 or 0.6% |
| West Pennants Hills | 13,121 | 13,213 | 92 or 0.7% |
| Haberfield/Summer Hill | 13,968 | 14,155 | 187 or 1.3% |
| Newport/Bilgola | 13,735 | 13,929 | 194 or 1.4% |
| Rosemeadow/Glen Alpine | 21,012 | 21,348 | 336 or 1.6% |
| Kurrajong Heights/Ebenezer | 22,127 | 22,498 | 371 or 1.7% |
| Belmore/Belfield | 19,693 | 20,058 | 365 or 1.8% |
| Wahroonga East/Warrawee | 18,222 | 18,599 | 377 or 2.1% |
| Double Bay/Bellevue Hill | 26,115 | 26,836 | 721 or 2.8% |
| Bayview/Elanora Heights | 10,901 | 11,228 | 327 or 3% |
At the other end of the spectrum, the Cobbity-Leppington and Zetland-Beaconsfield areas each welcomed a whopping 14,000 new residents over the five-year period, the most of any Sydney region.
Melbourne
Between 2012 and 2017, Taylors Lakes lost 342 residents, just shy of 2 per cent of the population.
In the city’s far north, the population of Mill Park dropped by 1 per cent, or 322 people.
In Rowville, there were 78 fewer residents, while in Hurstbridge, the population declined by 20 people.
Melbourne suburbs with stagnant populations
| Suburb | Est Population 2012 | Estimated Population 2017 | Change |
| Dingley Village | 10,597 | 10,644 | 47 or 0.4% |
| Thomastown | 21,420 | 21,531 | 111 or 0.5% |
| Meadow Heights | 15,739 | 15,831 | 92 or 0.6% |
| The Basin | 4417 | 4464 | 47 or 1.1% |
| Viewbank/Yallambie | 18,782 | 19,118 | 336 or 1.8% |
| Bulleen | 11,397 | 11,651 | 254 or 2.2% |
| Toorak | 13,795 | 14,123 | 328 or 2.4% |
| Aspendale Gardens/Waterways | 9216 | 9452 | 239 or 2.6% |
| Balwyn North | 21,005 | 21,574 | 569 or 2.7% |
In contrast, Cranbourne East grew by a massive 23,000 people, and the Melbourne city centre became home to 20,000 new residents. Meanwhile, Mernda’s population soared from 8412 to 19,623.
Demographers say suburbs with declining populations are often reaching the end of a first suburb life cycle, with adult children moving out of the family home, as opposed to residents leaving because they did not like the area.
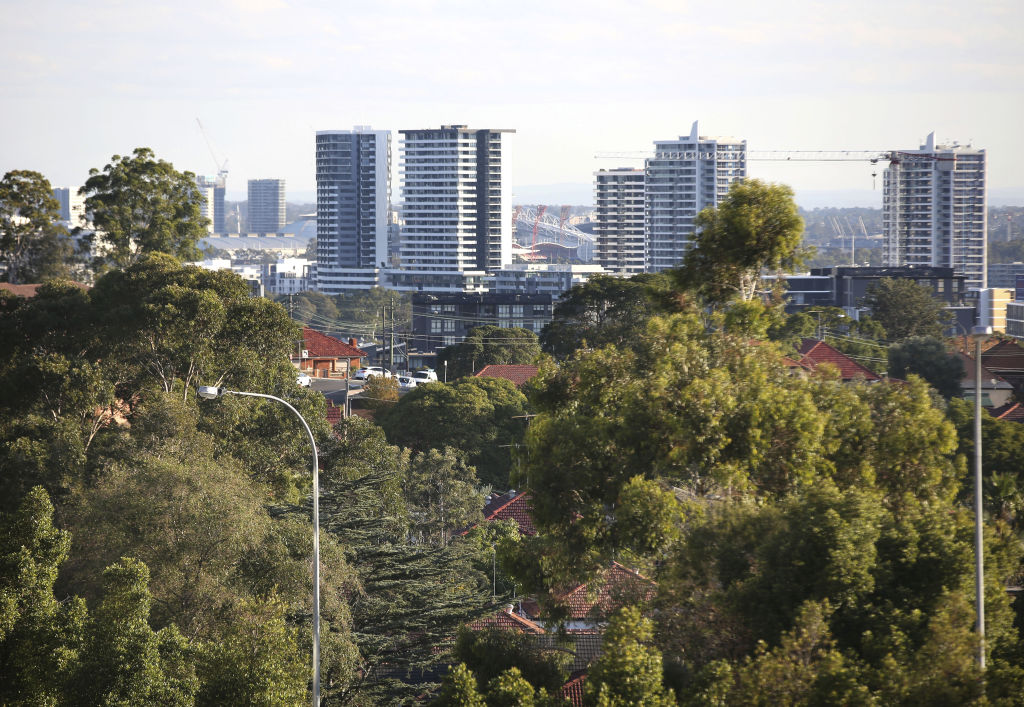
Suburbs that haven’t experienced much population growth may have zoning regulations acting as a barrier to increased density.
Domain research analyst Eliza Owen said the period between 2012 and 2017 was significant because it coincided with the trough-to-peak of the latest Sydney and Melbourne housing cycle.
“I see it as a time where house and unit values grew dramatically, but at the same time many new units were established in inner-city areas, and the population generally seems to have persisted with inner-city living.”
Between 2012 and 2017, the value of Sydney dwellings ticked up by an average of 10 per cent each year. Melbourne experienced a similar upswing, averaging growth of 7.4 per cent a year.
The ABS-estimated resident figures are based on dwelling approvals, the electoral roll and Medicare enrolments. It does not break down new migrants from inter-regional migrants, or births and deaths.
We recommend

Three signs you are in mortgage prison and how to break free


Are pubs a good investment in Australia?
We thought you might like


States
Capital Cities
Capital Cities - Rentals
Popular Areas
Allhomes
More
