Housing affordability Australia: Where property costs $25,000 per square metre
Property prices in Brisbane have soared by 41 per cent per square metre since the start of the pandemic, but still offer far better value than Sydney, Melbourne and Canberra, according to a new Domain report on the nation’s housing affordability.
Even though the price of a square metre of a house in Sydney rose by a comparatively much smaller 25 per cent since March 2020 to $2466, it’s still roughly twice that of homes in Brisbane, Adelaide and Perth.
Domain’s Housing Affordability: The Price Per Square Metre report, released on Friday, examined both property land size and its price per square metre to give a much more accurate view of the housing crisis than looking at simple changes in median values.
| Ranking | Median house price | Price per sqm | Median land size |
| 1 | Darwin, $646,835 | Darwin, $737 | Darwin, 806 sqm |
| 2 | Perth, $658,270 | Hobart, $1087 | Canberra, 748 sqm |
| 3 | Hobart, $737,650 | Adelaide, $1194 | Hobart, 655 sqm |
| 4 | Adelaide, $783,705 | Perth, $1233 | Brisbane, 617 sqm |
| 5 | Brisbane, $801,449 | Brisbane, $1254 | Adelaide, 600 sqm |
| 6 | Melbourne, $1,032,903 | Canberra, $1517 | Sydney, 574 sqm |
| 7 | Canberra, $1,095,587 | Melbourne, $1811 | Melbourne, 540 sqm |
| 8 | Sydney, $1,413,658 | Sydney, $2466 | Perth, 503 sqm |
It’s also a grimmer glimpse as it shows how homes are growing smaller, as well as more expensive.
“But what this report showcases for me is a comparison across Australia of what value you’re actually getting for your money,” said Domain chief of research and economics Dr Nicola Powell. “We can compare median prices, but what does that really buy you?
“Canberra, for example, has the second highest median price in the country for property, behind Sydney and higher than Melbourne, at $1,095,587 against Melbourne’s $1,032,903. But when we look at the price per square metre, it’s higher in Melbourne than it is in Canberra, at $1811 per square metre in Melbourne versus Canberra’s $1517.
“So your dollar goes further in our national capital than it does in the Victorian capital.”
Sydney came in at easily the highest price per square metre of its houses, terraces and townhouses, with Melbourne and Canberra next, then Brisbane at $1245 per square metre, Perth at $1233, Adelaide at $1194 and Hobart at $1087. Darwin was the lowest – or best value – at $737 per square metre.
Regional areas, meanwhile, have often been hit hard with huge increases in their square metreage prices.
In Albury on the northern side of the Murray in country NSW, for instance, the price per square metre has skyrocketed by 72 per cent since March 2020, with the NSW South Coast experiencing the second-biggest jump at 46 per cent.
| NSW | Since Mar-20 | Victoria | Since Mar-20 | Queensland | Since Mar-20 | ||
| Metro Sydney | 25% | Metro Melbourne | 11% | Metro Brisbane | 41% | ||
| Albury | 72% | Gippsland – South West | 56% | Maroochy | 68% | ||
| South Coast | 46% | Surf Coast – Bellarine | 47% | Caboolture | 66% | ||
| Shoalhaven | 38% | Ballarat | 50% | Caloundra | 58% | ||
| Gosford | 36% | Bendigo | 46% | Noosa | 50% | ||
| Wyong | 36% | Wodonga – Alpine | 46% | Bribie – Beachmere | 50% | ||
| Newcastle | 36% | Mornington Peninsula | 33% | Redcliffe | 48% | ||
| Wollongong | 30% | Geelong | 27% | Broadbeach – Burleigh | 48% | ||
| Compared to the December quarter of 2022. | Compared to the December quarter of 2022. | Compared to the December quarter of 2022. | |||||
In Victoria, the highest leap was in Gippsland in the state’s south-west, at 56 per cent, followed by Bellarine and the Surf Coast’s 47 per cent. In country Queensland, the biggest mover was the shire of Maroochy in the Sunshine Coast at 68 per cent, closely followed by Caboolture in the Moreton Bay Region, at 66 per cent.
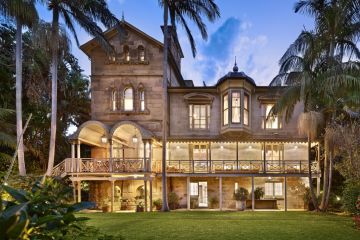
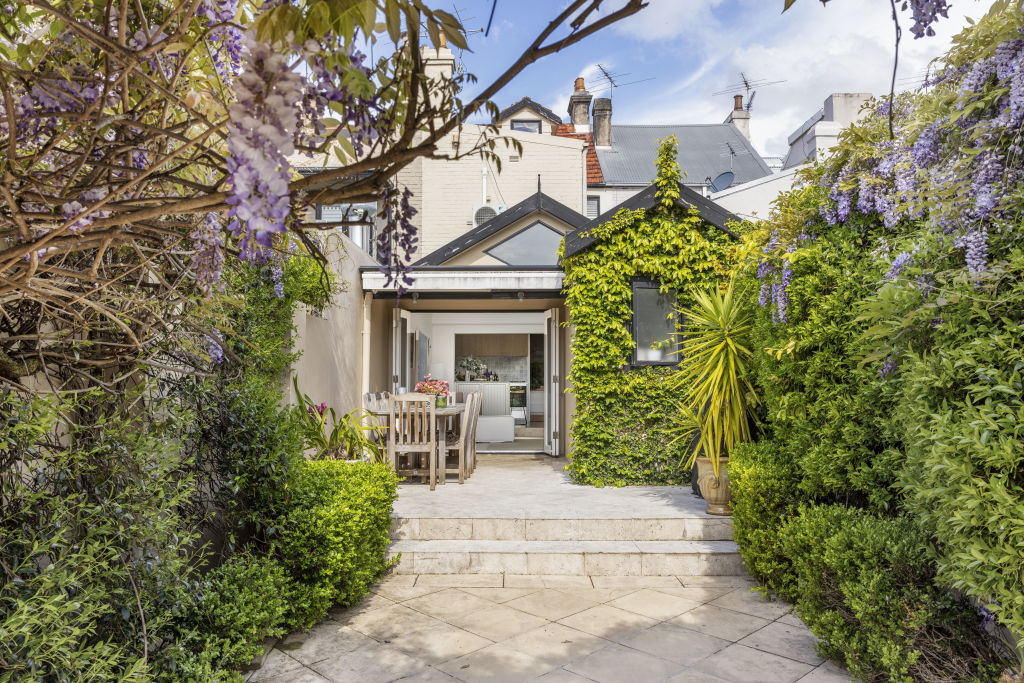
Among our cities, the most expensive piece of land that can be bought in Australia is now in Paddington, Sydney, where a square metre of home will take you back $25,755. Melbourne’s most pricey land – ranked at a lowly 26th on the national scale – is in Albert Park, where the same size will cost $13,915.
Adelaide’s dearest, meanwhile, is in Kent Town at $8937 per square metre, Perth’s is in Cottesloe at $7260, Brisbane’s is in Teneriffe at $7136, Hobart’s is in Battery Point at $6599, Darwin’s is in its city centre at $3504 and Canberra’s is in Crace at $3392 – coming in at a lowly 352nd place for the most expensive square metreage in the country.
“In some cities, you’re getting much more for your money than in others,” said Powell. “When we look at the square metreage, Sydney is now so far apart in value from the other capital cities.
“Other factors play into this, too. Over the last 10 years, the average block size has shrunk by 13 per cent in the larger capital cities due to changes in planning codes and population pressure.
“Melbourne and Perth, for example, have the lowest median land sizes for houses, and Darwin and Canberra have the biggest. So these factors all work together to provide a different way of looking at prices.”
Knowing the price per square metre of any home will allow buyers, in the future, to compare more accurately the value proposition of different houses – whether big or small – as well as to evaluate others in different neighbourhoods, suburbs and towns.
“Some areas may have a higher median price but you’ll actually get more bang for your buck there, whereas those with a lower median price might offer less value per square metre,” said Powell. “It should help people work out more readily what they can afford, where.”

We recommend
States
Capital Cities
Capital Cities - Rentals
Popular Areas
Allhomes
More
