The fastest-selling properties of 2023
The 2023 housing market had properties flying off the shelves, despite high interest rates, lower borrowing capacities and a cost of living crisis. In some parts of the country, properties are spending just one week on the market before being snapped up.
In many areas, supply is not meeting demand and new listings disappear in the blink of an eye, making it feel like a race against time to snatch up your dream home before someone else does.
The Domain End of Year Wrap 2023 report has revealed the fastest-selling suburbs in the country – and they’re not just the competitive areas of Sydney or Melbourne.
While across the country houses are taking longer to sell than last year, there are still suburbs that remain difficult to crack for buyers – especially in Perth.
Here are the top 10 fastest-selling suburbs in Australia by state for 2023
Western Australia
| Rank | State | Suburb | Postcode | Average days on market |
| 1 | WA | Leda | 6170 | 8 |
| 2 | WA | Brookdale | 6112 | 10 |
| 3 | WA | Hillman | 6168 | 12 |
| 4 | WA | Darling Downs | 6122 | 12 |
| 5 | WA | Ridgewood | 6030 | 14 |
| 6 | WA | Hocking | 6065 | 15 |
| 7 | WA | Seville Grove | 6112 | 15 |
| 8 | WA | Kwinana Town Centre | 6167 | 16 |
| 9 | WA | Pearsall | 6065 | 16 |
| 10 | WA | Hilbert | 6112 | 17 |
Topping the chart is the Perth suburb of Leda, 41 kilometres from the CBD, where, on average, a property spends eight days on the market. A close runner-up in Western Australia is Brookdale at 10 days, followed by Hillman at 12 days.
Leda’s average of eight days on market is an anomaly compared with Perth’s average of 62 days, because investors are buying lower-end properties in droves as infrastructure development booms, says local agent Alice Williams of 1st Place Realty.
“A lot of money is being plunged into the area as a whole in terms of infrastructure and industry and all sorts of stuff,” she says. “There is so much development work going on there.
“Leda is a good investment suburb. [Properties] are cheap, affordable and near the freeway. And you can commute to the city quite easily. It’s not too far from the beach.”
NSW
| Rank | State | Suburb | Postcode | Average days on market |
| 1 | NSW | Normanhurst | 2076 | 13 |
| 2 | NSW | Dean Park | 2761 | 13 |
| 3 | NSW | Birrong | 2143 | 17 |
| 4 | NSW | Wetherill Park | 2164 | 18 |
| 5 | NSW | North St Marys | 2760 | 19 |
| 6 | NSW | Glenwood | 2768 | 20 |
| 7 | NSW | Yarrawarrah | 2233 | 20 |
| 8 | NSW | Westleigh | 2120 | 20 |
| 9 | NSW | St Peters | 2044 | 22 |
| 10 | NSW | Kings Langley | 2147 | 23 |
In NSW, the fastest-selling suburbs are Normanhurst and Dean Park, with an average of 13 days on the market. They were followed by Birrong with an average of 17 days.
Normanhurst is 30 kilometres north of the Sydney CBD, close to Hornsby, and is known for its large homes and land.
Gary Ward of Century 21 Radar Properties says people who buy in the suburb typically search for property in the Wahroonga region and find that Normanhurst is several million dollars cheaper.
“If you’re a buyer and you’ve got $3 million you won’t get much in Wahroonga,” he says. “But you pop yourself into Normanhurst and you could get something really nice, or do it up, or it’ll already be done up.”
Ward believes Normanhurst properties are flying off the shelf because the suburb offers easy walking access to amenities like public transport, private schools and shopping centres.
“[Normanhurst is] 30 minutes away from Sydney CBD and one house is nearly 900 square metres,” he says. “It’s prime real estate.”
Victoria
Rank
State
Suburb
Postcode
Average days on market
1
VIC
Watsonia North
3087
21
2
VIC
Croydon Hills
3136
23
3
VIC
Tecoma
3160
24
4
VIC
Lysterfield
3156
27
5
VIC
Blind Bight
3980
28
6
VIC
Selby
3159
28
7
VIC
Briar Hill
3088
28
8
VIC
Chelsea Heights
3196
28
9
VIC
Blackburn South
3130
28
10
VIC
Wattle Glen
3096
29
Watsonia North is 17 kilometres north-east of the Melbourne CBD and is the fastest-selling suburb in Victoria, with properties spending an average of 21 days on the market.
“Watsonia North is a secondary suburb to Watsonia, Bundoora and Greensborough,” says Brett Sparkes of Jellis Craig Greensborough.
“We’re finding that the attention is mostly focused on those larger, bigger suburbs and then suddenly Watsonia North is a secondary but a lot of people forget about it.
“They notice the location is really good for schools and shops and lifestyle – and [it] doesn’t impact anyone else’s lifestyle that much if they don’t live in those bigger suburbs.
“Everything is within close proximity without needing to be right in one of those major, more expensive suburbs.”
Sparkes says he has seen a lot of young families moving into Watsonia North, and older people who have owned their homes for more than 40 years are moving out.
Watsonia North is followed by Croydon Hills, with 23 days on the market, and Tecoma with an average of 24 days.
Queensland
Rank
State
Suburb
Postcode
Average days on market
1
QLD
Brendale
4500
18
2
QLD
Laidley North
4341
22
3
QLD
Holmview
4207
24
4
QLD
Enoggera
4051
25
5
QLD
Keperra
4054
26
6
QLD
Chermside West
4032
26
7
QLD
Laidley Heights
4341
26
8
QLD
Annerley
4103
27
9
QLD
Carina
4152
27
10
QLD
Wishart
4122
28
In the sunshine state, Brendale, 23 kilometres north of Brisbane City, is the fastest-selling suburb. There, the average property spends 18 days on the market.
Other fast-selling areas include the small rural suburb of Laidley North, with an average of 22 days.
ACT
| Rank | State | Suburb | Postcode | Average days on market |
| 1 | ACT | Fraser | 2615 | 31 |
| 2 | ACT | Hawker | 2614 | 33 |
| 3 | ACT | Higgins | 2615 | 34 |
| 4 | ACT | Cook | 2614 | 35 |
| 5 | ACT | Florey | 2615 | 36 |
| 6 | ACT | Nicholls | 2913 | 36 |
| 7 | ACT | Evatt | 2617 | 37 |
| 8 | ACT | Latham | 2615 | 39 |
| 9 | ACT | Hackett | 2602 | 39 |
| 10 | ACT | Fisher | 2611 | 40 |
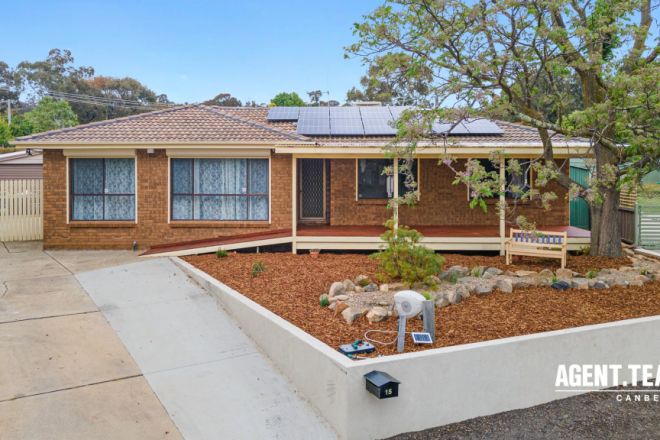
Properties in Fraser, in the Belconnen region, spend an average of 31 days on the market. Properties are also quick to sell in nearby Hawker, with an average of 33 days, and in Higgins, with 34 days.
These three suburbs are known for having properties with larger blocks of land. They sit about 13 kilometres north-west of the Canberra CBD.
South Australia
| Rank | State | Suburb | Postcode | Average days on market |
| 1 | SA | Hillier | 5116 | 39 |
| 2 | SA | Woodville Park | 5011 | 45 |
| 3 | SA | Tonsley | 5042 | 45 |
| 4 | SA | Marryatville | 5068 | 47 |
| 5 | SA | Clovelly Park | 5042 | 47 |
| 6 | SA | Oakden | 5086 | 48 |
| 7 | SA | Marion | 5043 | 48 |
| 8 | SA | Hackham West | 5163 | 49 |
| 9 | SA | Willunga | 5172 | 50 |
| 10 | SA | Smithfield | 5114 | 51 |
Properties in South Australia spend over a month on the market, with the northern Adelaide suburb of Hiller being the fastest. Property there takes an average of 39 days to sell, while those in greater Adelaide spend an average of 64 days on the market.
Tasmania
| Rank | State | Suburb | Postcode | Average days on market |
| 1 | TAS | Rosny | 7018 | 22 |
| 2 | TAS | Mount Nelson | 7007 | 28 |
| 3 | TAS | Seven Mile Beach | 7170 | 29 |
| 4 | TAS | Glebe | 7000 | 33 |
| 5 | TAS | Cambridge | 7170 | 34 |
| 6 | TAS | Lauderdale | 7021 | 45 |
| 7 | TAS | Oakdowns | 7019 | 48 |
| 8 | TAS | Clarendon Vale | 7019 | 49 |
| 9 | TAS | Taroona | 7053 | 50 |
| 10 | TAS | Risdon Vale | 7016 | 50 |
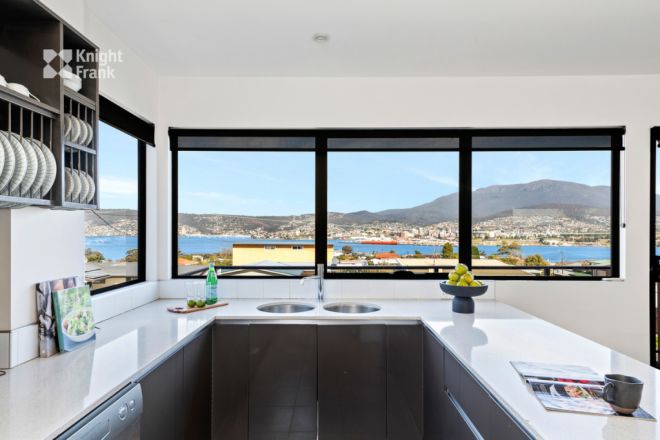
Properties in Tasmania take from 22 days to more than two months to be sold, depending on the region. In Hobart, the typical house spends 73 days on the market.
The fastest-selling suburb in the state is Rosny – located in the greater Hobart area, four kilometres from the CBD – and on the eastern shore of the River Derwent.
Northern Territory
Rank
State
Suburb
Postcode
Average days on market
1
NT
Nakara
810
74
2
NT
Woolner
820
81
3
NT
Tiwi
810
85
4
NT
Ludmilla
820
88
5
NT
Johnston
832
90
6
NT
Brinkin
810
90
7
NT
Wulagi
812
100
8
NT
The Gardens
820
103
9
NT
Farrar
830
103
10
NT
Wanguri
810
104
Most of the suburbs in the Northern Territory spend more than two months on the market before finding a buyer.
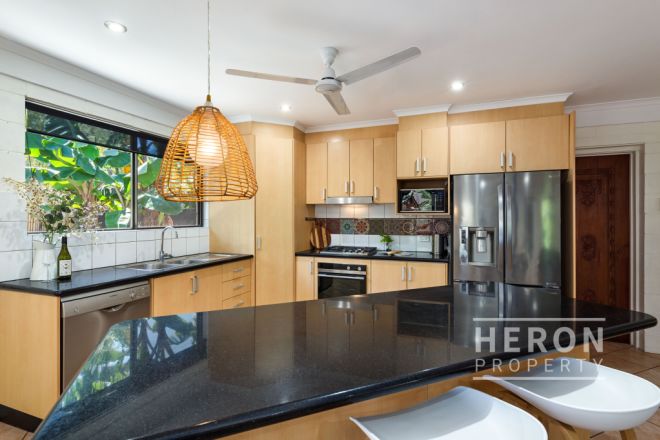
Darwin properties take an average of 123 days to sell, making it the capital city where houses are on the market the longest.
Nakara – a northern Darwin suburb – is the Northern Territory’s quickest-selling suburb, where properties, on average, spend 74 days on the market before being sold.
We recommend
States
Capital Cities
Capital Cities - Rentals
Popular Areas
Allhomes
More
