The one chart that shows the true state of distressed listings in Australia
Everything in Australia seems to be increasing in number – interest rates, costs of goods and services, property prices, the temperature – but the number of people selling their homes because they can’t afford their mortgages is actually on the decline.
New Domain figures show a clear decrease in distressed listings across the capital cities, despite forecasts of the great “fixed rate mortgage cliff” – where thousands of home owners were expected to fall into distress financially and be forced to sell due to higher interest rates.
In spite of all the predictions, this rise in distress sales has yet to happen; in fact, it’s quite the contrary.
“That line graph says it beautifully — we’ve got those areas of prices rising, and as the market has recovered, the portion of distress listings reduced,” says Domain chief of research and economics Dr Nicola Powell.
“They all point in the same direction in terms of positivity in our housing market,” she says.
Distressed listings are when properties are sold urgently, typically due to financial struggles, before banks potentially repossess the home.
Powell says that instead, “what this data set does is it picks up those vulnerable home owners who are perhaps struggling with the higher cost of debt. And they need to offload before they get into the mortgage repossession situation.”
Stephen Halmarick, chief economist and head of global economic and markets research at Commonwealth Bank of Australia, says he’s not surprised by the low level of distressed listings.


Speaking at the Commonwealth Private’s Property Pulse last week, he says the last thing people stop paying is their mortgage.
“They reduce spending on lots of other things first,” he says. “The unemployment rate is still very very low, and that helps a lot. There’s a lot of outreach going on from banks.”
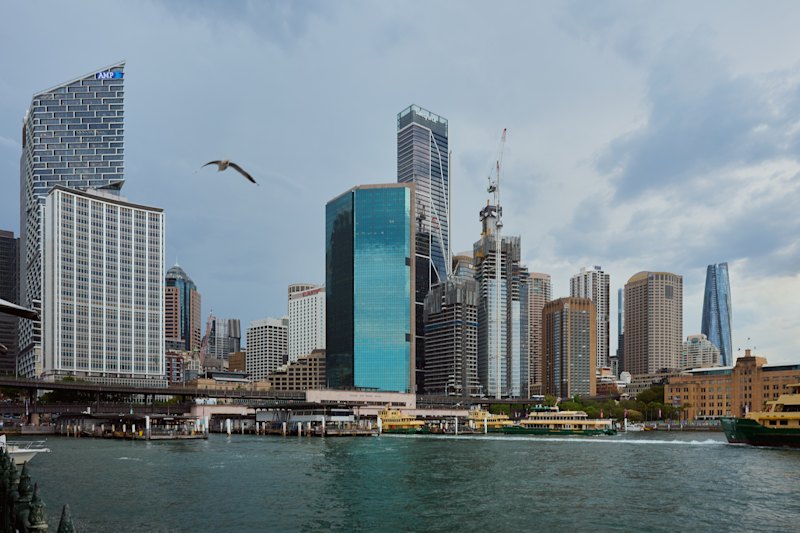
In Sydney, only 3.3 per cent of listings were from distressed sellers, compared to 4.7 per cent this time last year.
In Melbourne, it was down 0.4 percentage points from 2.0 per cent in August 2022. Hobart and Darwin were also down 0.4 points from 1.1 per cent and 5 per cent, respectively, while Perth experienced a 1.3 point decrease from 3.7 per cent. The sharpest decline came from Brisbane, with a 2.4 point decrease from 6.6 per cent.
“The capital cities’ level of distress listings remain very contained. And they shrunk across many of our cities every single month this year,” Powell says. “Overall, it showcases that home owners are adjusting to financial circumstances to meet mortgage repayments.”
“The other thing is our housing market is into recovery, so when somebody does need to sell, the likelihood of them actually selling for less than what they purchased is actually diminishing over time. ”
Powell believes the number of distressed listings will continue to shrink as the market recovers further.
The Domain data has found that eight of the top 10 regions leading the distressed listing shrinkage in the country are in Queensland.
| SA3 | State | Aug-23 | Aug-22 | Annual Change (percentage points) |
| Wynnum – Manly | QLD | 7.1% | 16.5% | -9.4 |
| Coolangatta | QLD | 3.6% | 11.1% | -7.5 |
| Pennant Hills – Epping | NSW | 3.3% | 8.9% | -5.6 |
| Mt Gravatt | QLD | 10.2% | 15.6% | -5.4 |
| Surfers Paradise | QLD | 8.6% | 13.6% | -5.0 |
| Capalaba | QLD | 5.3% | 10.3% | -5.0 |
| The Hills District | QLD | 2.2% | 7.2% | -5.0 |
| Brisbane Inner – East | QLD | 3.2% | 8.1% | -4.9 |
| Holland Park – Yeronga | QLD | 3.6% | 8.3% | -4.7 |
| Fairfield | NSW | 7.3% | 12.0% | -4.7 |
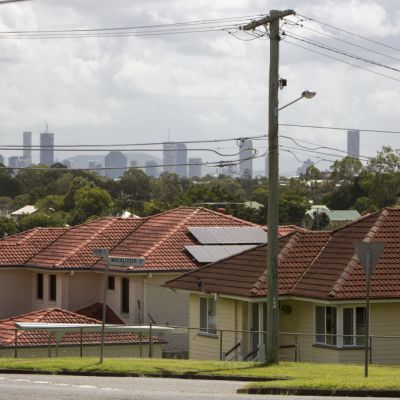
In Brisbane’s eastern region of Wynnum-Manly, the data found only 7.1 per cent of listings in August were from distressed sellers. That figure was 16.5 per cent last year.
Local agent Katie Daunt of Coronis Bayside says the decrease in distressed sales could be related to the generally low number of listings in the market.
However, the distressed sales she’s seen recently have been investors offloading their properties.
“They are offloading not because they are desperate by any means, but often offloading because interest rates have risen. They might not be in positions where they [can] increase the rent or have increased the rent, and it’s not at a level that’ll cover the cost that they have if they have a couple of properties,” she says.
“I guess it’s a bit more forward-thinking as opposed to being reactive when things are just too last minute.”
Daunt has also noticed that some home owners who bought at a premium in 2021 and 2022 have returned to the market, and she believes it could be because people were “re-evaluating their circumstances as interest rates rose.”
She feels the general market has improved thanks to a growth in buyer confidence and stabilising interest rates.
Powell says even though the market is improving and distressed listings are low, pockets of weakness will always exist and are more likely to be in mortgage belts – areas where it’s more affordable and tends to attract first-time buyers.
One example is the SA3 region of Blacktown in western Sydney, where distressed listings have increased by 7 per cent in the last year, up to 15.7 per cent.
Local agent Joseph Scarcella of Prime Real Estate Agents Marayong says this is due to a number of factors.
“Interest rates have gone up, people can’t make their mortgage payments, [investors] are sick of holding investor properties because the cost of holding them is too dear.”
Scarcella has also seen a rise in investors offloading their properties in the past couple of months.

“The cost of holding [investment properties] is now greater than it was last year or the year before,” he says.
“The group that I talk to are mainly investors, and they are pretty much over [interest rate hikes] and the whole owning an investment property. They could probably put their money in a vehicle that can give them a greater return.”
With Ellen Lutton
We recommend


We thought you might like


States
Capital Cities
Capital Cities - Rentals
Popular Areas
Allhomes
More
