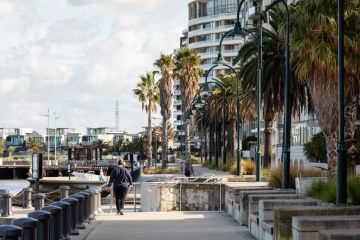
What is liveability and what were our suburbs ranked on?
What makes a suburb? For some, it’s the people who live there. For others, it’s the access to amenities and for others, it’s both.
The new Domain Liveable Cities study, authored by Deloitte Access Economics and Tract Consultants, conducted for Melbourne, Sydney and, for the first time, Brisbane, aims to show how our suburbs measure up.
So why measure liveability? First, there’s more to our suburbs than just property prices. While that’s important, people’s choice to live in one suburb over another is determined by several factors. The information in our Domain Liveable Cities series arms Australians with plenty of insights about the suburb they live in, and the one they may move to next.
Second, for our suburbs to continue to function as they house more people in the future (complain all you like, it’s happening), they must be liveable.
The study shows, contrary to what some would argue, that higher-density suburbs are more likely to be liveable.
Arguably that’s because they’re often older suburbs undergoing significant change, and the trade-off is increased traffic congestion given a nationwide lack of future planning and infrastructure provision. So measuring liveability throws into the spotlight the ability of our suburbs to provide amenity for locals.
Across Sydney, Melbourne and Brisbane, 16 indicators were measured: density of cultural services, retail, cafes and restaurants, access to trains and buses, employment, crime, primary and secondary education, mobile and internet access, open space, tree cover, topographic variation, coast and beach proximity, walkability and congestion.
In Sydney and Brisbane, access to ferries was also measured, while access to trams was critical in Melbourne. Sydney and Brisbane airport noise was also included, and Sydney alone had harbour and ocean views measured.
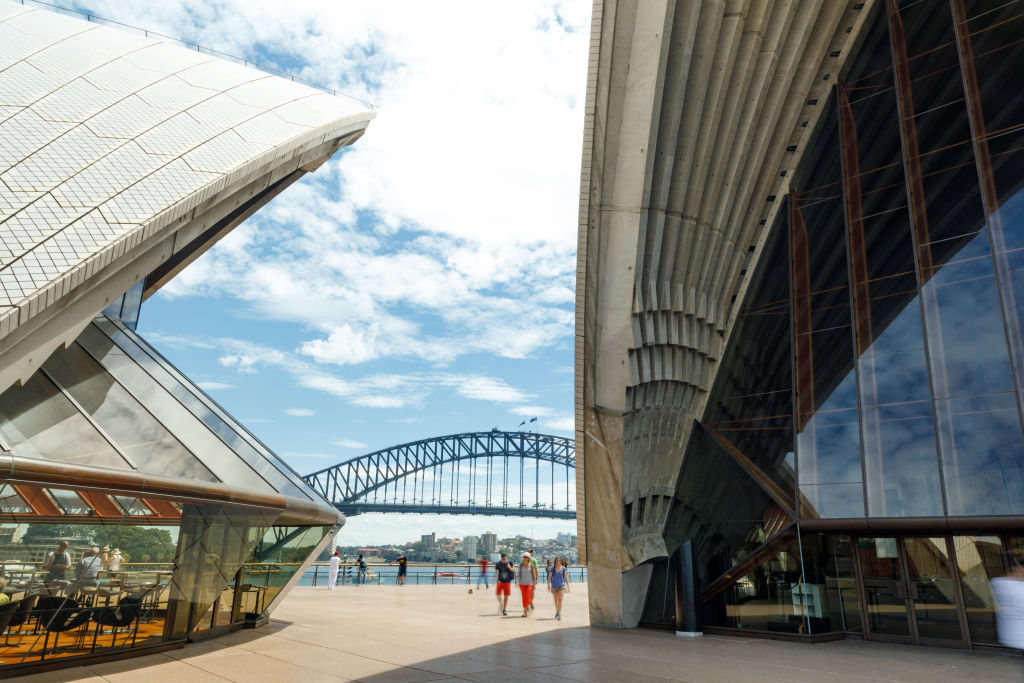
So what do these mean, and why are they important?
- Culture
Calculated as the density of cultural services in a suburb, such as libraries, museums and galleries. Because life’s richer with a bit of culture every now and then.
- Retail
Measured here were the density of retail offerings and the proportion of a suburb covered by retail outlets. It’s always easier when there’s somewhere nearby to grab a loaf of bread or some milk.
- Cafes and restaurants
This indicator measured the density of cafes and restaurants in a suburb, and the proximity of them, given most people enjoy being able to head somewhere nearby for a great brew.
- Employment
Being close to work is always a bonus, so suburbs with big job hubs scored well. The less time it takes you to get to work, the better off you’d be. This indicator measures the proportion of a suburb’s population that can walk to work.
- Train/bus/tram
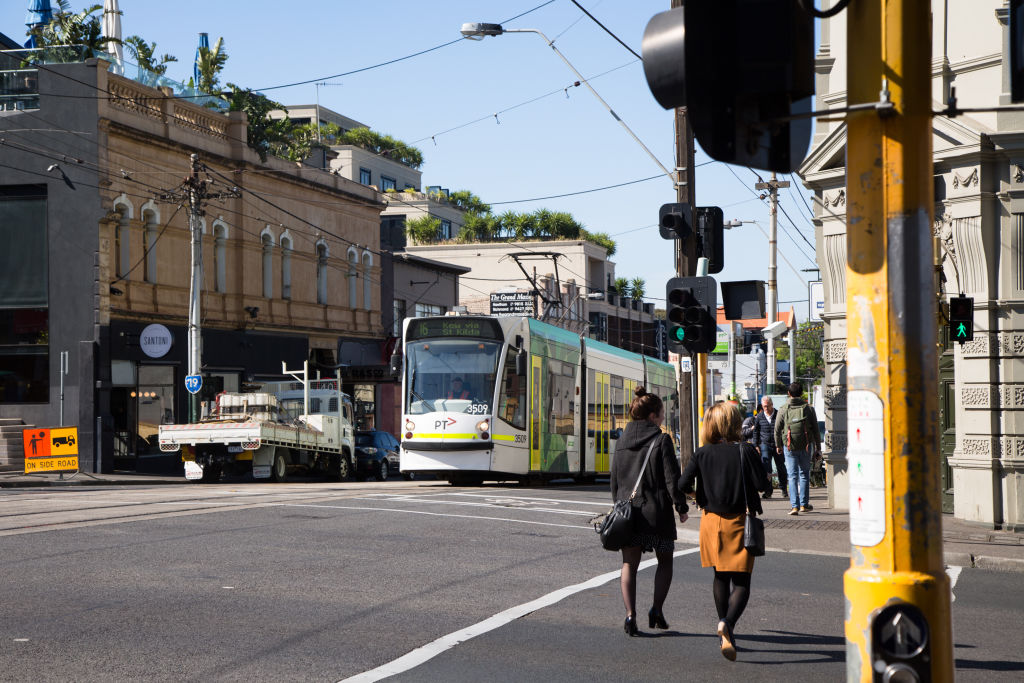
Measured separately for the purposes of the suburb ranks, public transport is a necessity for cities the size of ours. The study measured access to train stations and bus stops from the centre of a suburb. The quality and/or frequency of services, though, was not measured.
- Ferry
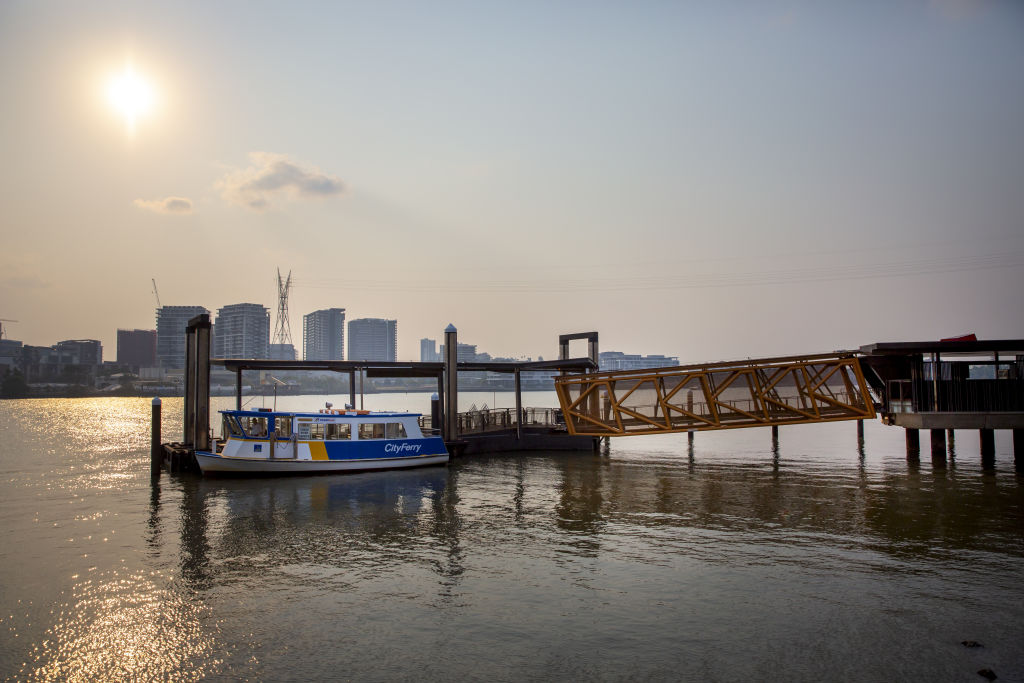
Crucial in Sydney and Brisbane, the study measured the average distance from the centre of a suburb to the closest ferry wharf with regular services. The frequency and quality of those services was not measured given the study is about provision of services – and the ability for that provision. Suburbs more than six kilometres from a ferry terminal were excluded.
- Open space
Classified as the percentage of a suburb that is publicly available open space, for those times when you want to walk the dog, kick the footy or just get outside.
- Tree cover
Calculated as the percentage of tree canopy cover within each suburb. Important given an increasing amount of scientific literature associates trees with better health outcomes.
- Crime
An obvious negative. Measured as the number of offences per 100,000 resident population.
- Education
A non-negotiable for parents, this assesses the proximity to primary and secondary schools from the centre of a suburb. Important to note that this does not assess the quality of any given school. Let’s save that debate for another time!
- Airport noise
Factored in only for Sydney and Brisbane, given the distance of Melbourne Airport to the great proportion of suburbs. Something many can agree isn’t desirable, no matter how long you deal with it.
- Mobile and broadband
No escaping the necessity these days. This takes into account the quality and availability of services.
- Topographic variation
Included with the presumption that hills allow for views, which are nice to have.
- Walkability
Included in the study for the first time, this indicator measures a suburb’s walkable access to employment, shops and/or transport. A suburb needs not only to be walkable but there needs to be something to walk to.
- Traffic congestion
Using Uber Movement data, which the ridesharing app provides publicly in a bid to aid urban planning worldwide, this indicator measured the difference in average trip time between peak and off-peak periods. Because who likes to be stuck in traffic?
- Coast proximity (beach proximity in Sydney)
The average straight line from a suburb’s centre to the closest coast line or beach. While it’s not crucial, it’s definitely a bonus.
- Harbour and ocean views
Calculated as the proportion of the suburb that has views to the harbour, a bay or the ocean. Smaller suburbs had the edge here, with many in tiny Dolans Bay enjoying this luxury that research shows a lot of people are willing to pay a premium for.
In developing the study, key decisions were made. The study as a whole focuses on the attributes of the place, rather than the people in it. Also required: broad agreement that more or less of a factor was a good thing. Most people agree that less congestion on the roads is a positive, but it is unclear if more rainfall is good or bad.
Additionally, the study recognised that people in a suburb are willing to travel outside of the one in which they live for certain amenity. The fact that a large park, for example, might be located in a suburb next to another that lacked public space was accounted for.
This time we also measured the best suburbs for young families, Millennials and Baby Boomers. Families were assumed to prioritise access to schools, parks and retail and desire a suburb with minimal crime. Millennials were presumed to prioritise culture, cafes, public transport and local jobs, while Boomers were presumed to prefer retail, cafes, open space and proximity to the coast or beach.
Of course, these are generalisations because no one set of criteria will fit every single person. But they are presumed to account for a broad community consensus and preference.
So, what do you think? Take the quiz – in Brisbane, Sydney and Melbourne – to see what suburb best suits you and then let us know what you make of the quiz.
We recommend
States
Capital Cities
Capital Cities - Rentals
Popular Areas
Allhomes
More

